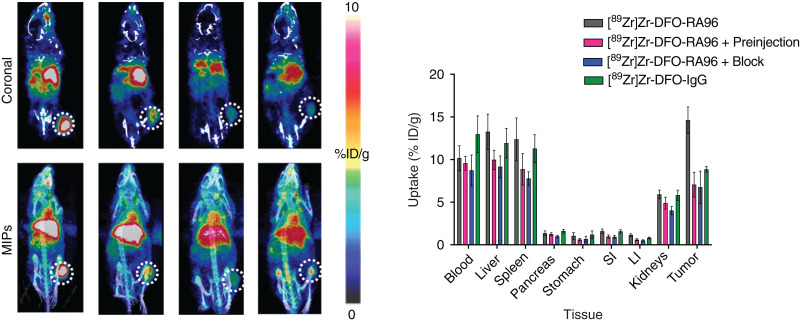
FIGURE 3.
Serial PET/CT imaging of 89Zr-DFO-RA96 and 89Zr-DFO-IgG, with corresponding ex vivo biodistribution at 144 h. Images are represented as coronal slices (A) and maximum-intensity projections (MIPs) (B). Tumors are on right flank and encircled by dotted line. Significant differences are noted when comparing 89Zr-DFO-RA96 with all control groups (P < 0.001). “Preinjection” indicates partial block, with ×3 amount of unlabeled antibody injected 4 h before injection with 89Zr-DFO-RA96. “Block” indicates full block with ×30 amount of unlabeled antibody coinjected with 89Zr-DFO-RA96. “IgG” indicates injection of isotype-matched control 89Zr-DFO-IgG. Mice were retroorbitally bled from right eye 1 wk previously, resulting in nonspecific uptake of radiotracer in eye region. LI = large intestine; SI = small intestine.

