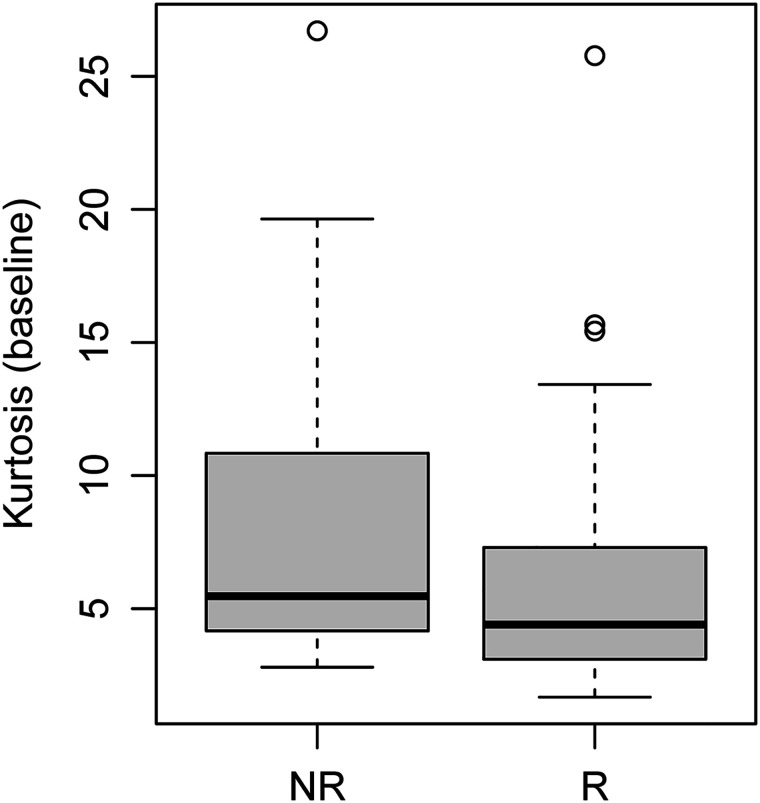
FIGURE 5.
Kurtosis on baseline 68Ga-DOTATATE PET/CT. Distribution of kurtosis was estimated from 68Ga-DOTATATE tumor volumes (P = 0.031). Box plot represents median and upper and lower quartiles of each distribution, with whiskers showing limits of distribution (1.5 times interquartile range). NR = nonresponders; R = responders.

