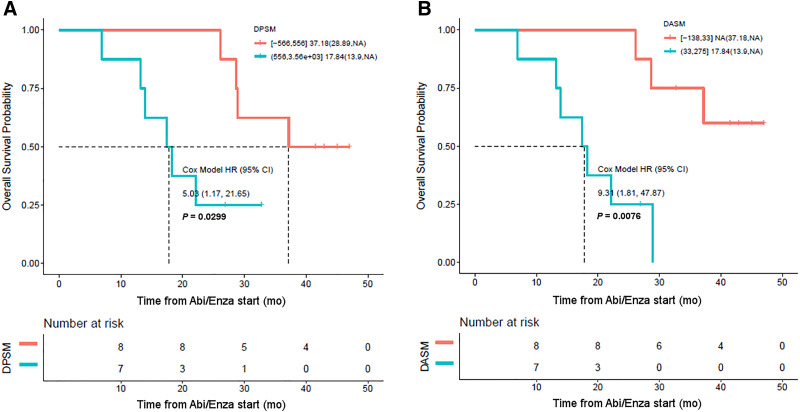
FIGURE 5.
(A) Kaplan–Meier curve demonstrating that DPSM is associated with OS, with high DPSM corresponding to patients with shorter OS (blue curve) and low DPSM corresponding to patients with longer OS (orange curve). (B) Similar results were found with DASM. Abi/Enza = abiraterone/enzalutamide; HR = hazard ratio.

