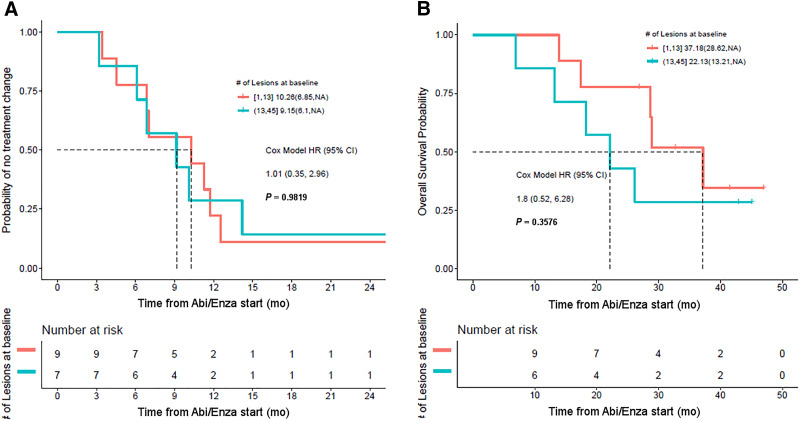
FIGURE 6.
(A) Kaplan–Meier curves showing no difference in TTTC in patients with high PSMA-avid tumor burden at baseline (blue curve) and low PSMA-avid tumor burden at baseline (red curve). (B) Patients with lower baseline tumor burden also did not have significantly better OS. Abi/Enza = abiraterone/enzalutamide; HR = hazard ratio.

