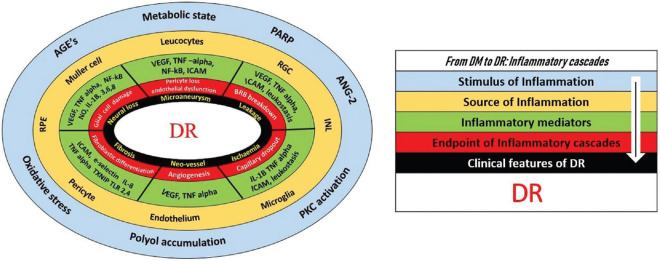
Figure 3.
Doughnut chart representing the inflammatory pathogenesis of DR. The outermost blue circle represents the stimulus of inflammation developing outside the retina as a consequence of the metabolic state. The second circle shows the beginning of the retinal inflammation and the cells being stimulated as the source to produce the cytokines. The circles further in have been categorized to show how the inflammatory mediators are getting involved in the cascades to lead on to specific pathologic and cellular level changes in the retina that subsequently manifests as a clinical finding, completing the circle of diabetes mellitus (DM) to diabetic retinopathy (DR). There is tremendous overlapping at all levels of this process, horizontally as well as vertically. AGE: Advanced glycation end products, PKC: Protein kinase C, PARP: Poly-ADP ribose polymerase, ANG: Angiotensin, INL: Inner nuclear layer, RPE: Retinal pigment epithelium, RGC: Retinal ganglion cell

