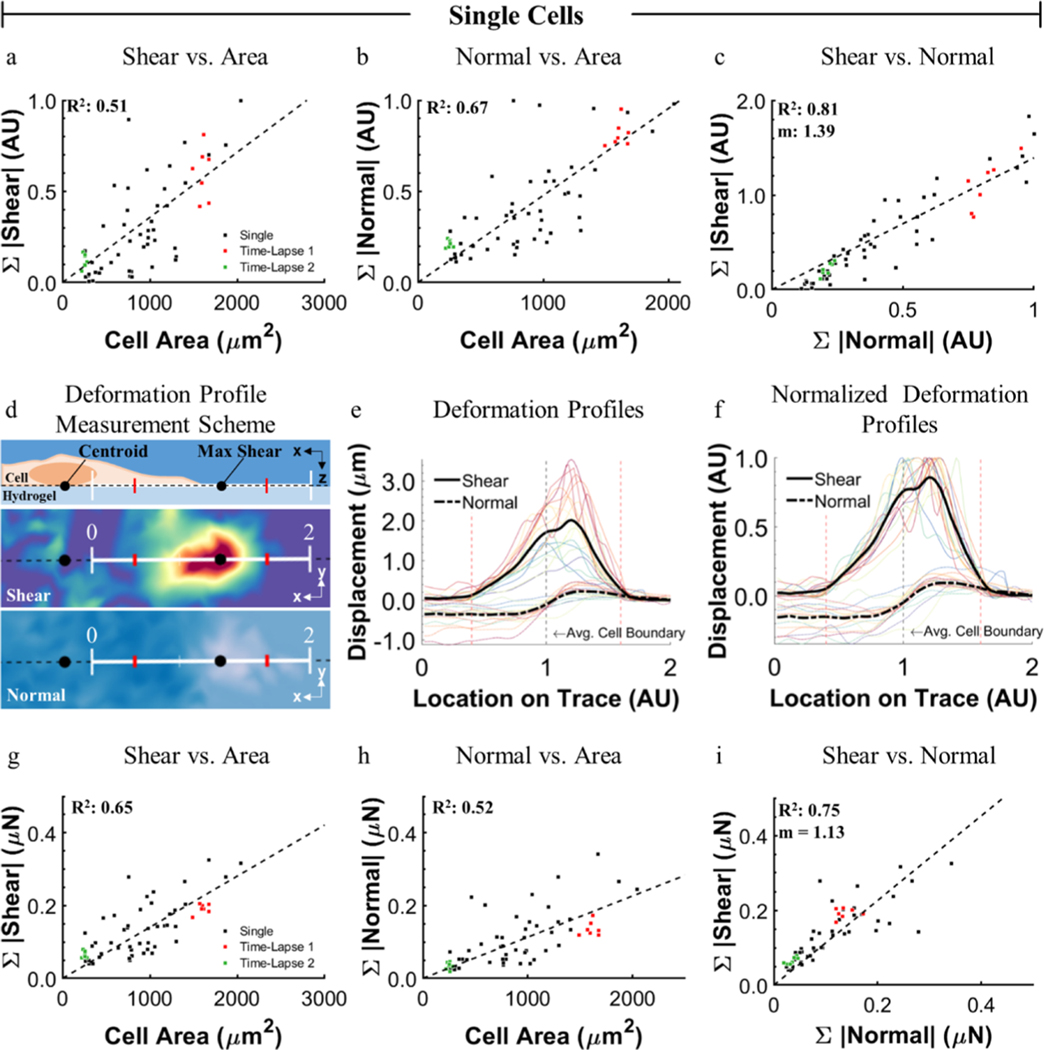
Figure 5.
Magnitudes and distributions of cell-induced hydrogel deformations and forces. Positive linear correlations exist between both (a) shear and (b) normal deformation with increased cell spreading for individual single cells. Black markers represent different individual cells and red and green markers are time-lapse measures of specific cells. (c) Strong linear correlation was observed between the sum of shear and normal deformation magnitudes (normalized to highest normal magnitude). n = 60 data points for (a–c). The distribution of shear and normal deformation was measured along a trace from the cell center through the maximum shear. (d) Lengths of the profiles were normalized so that the proximal and distal locations where the magnitude of shear was 20% of the maximum occurred at 0.4 and 1.6 (red ticks). (e,f) 22 profiles of shear and normal deformation, with the average plotted in black. The transition from negative to positive normal deformation occurs at the cell boundary, with maximum shear coinciding with maximum positive normal deformation. (g–i) Calculated shear and normal traction components corresponding to (a–c), respectively.

