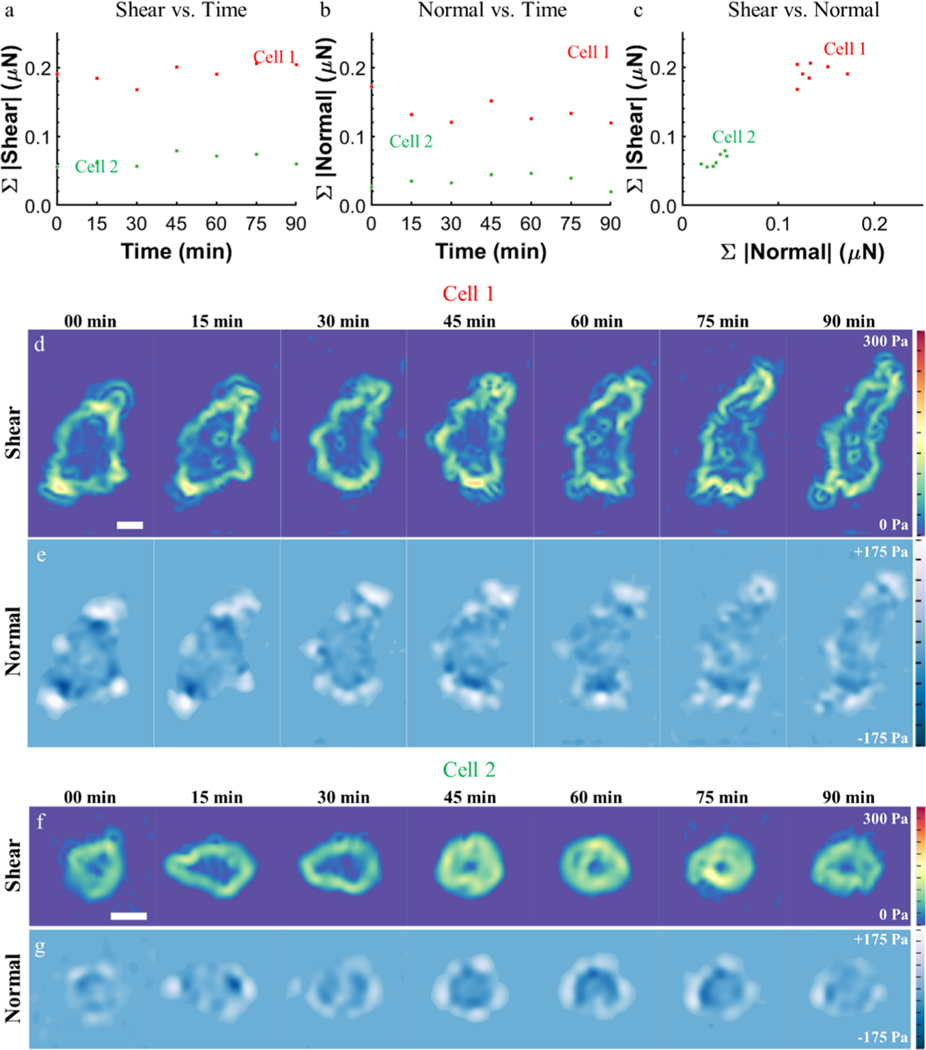
Figure 6.
Time-lapse, cell-induced hydrogel traction measurements. The sum of (a) shear and (b) normal components of traction for a well-spread cell (cell 1) and a spreading cell (cell 2) over 90 min at 15 min intervals. (c) Although shear and normal traction magnitudes vary with time, their magnitudes are linearly correlated at all time points. Heatmaps of (d,f) shear stress and (e,g) normal stress for cell 1 and cell 2. SB = 20 μm. See Movies S1 and S2.

