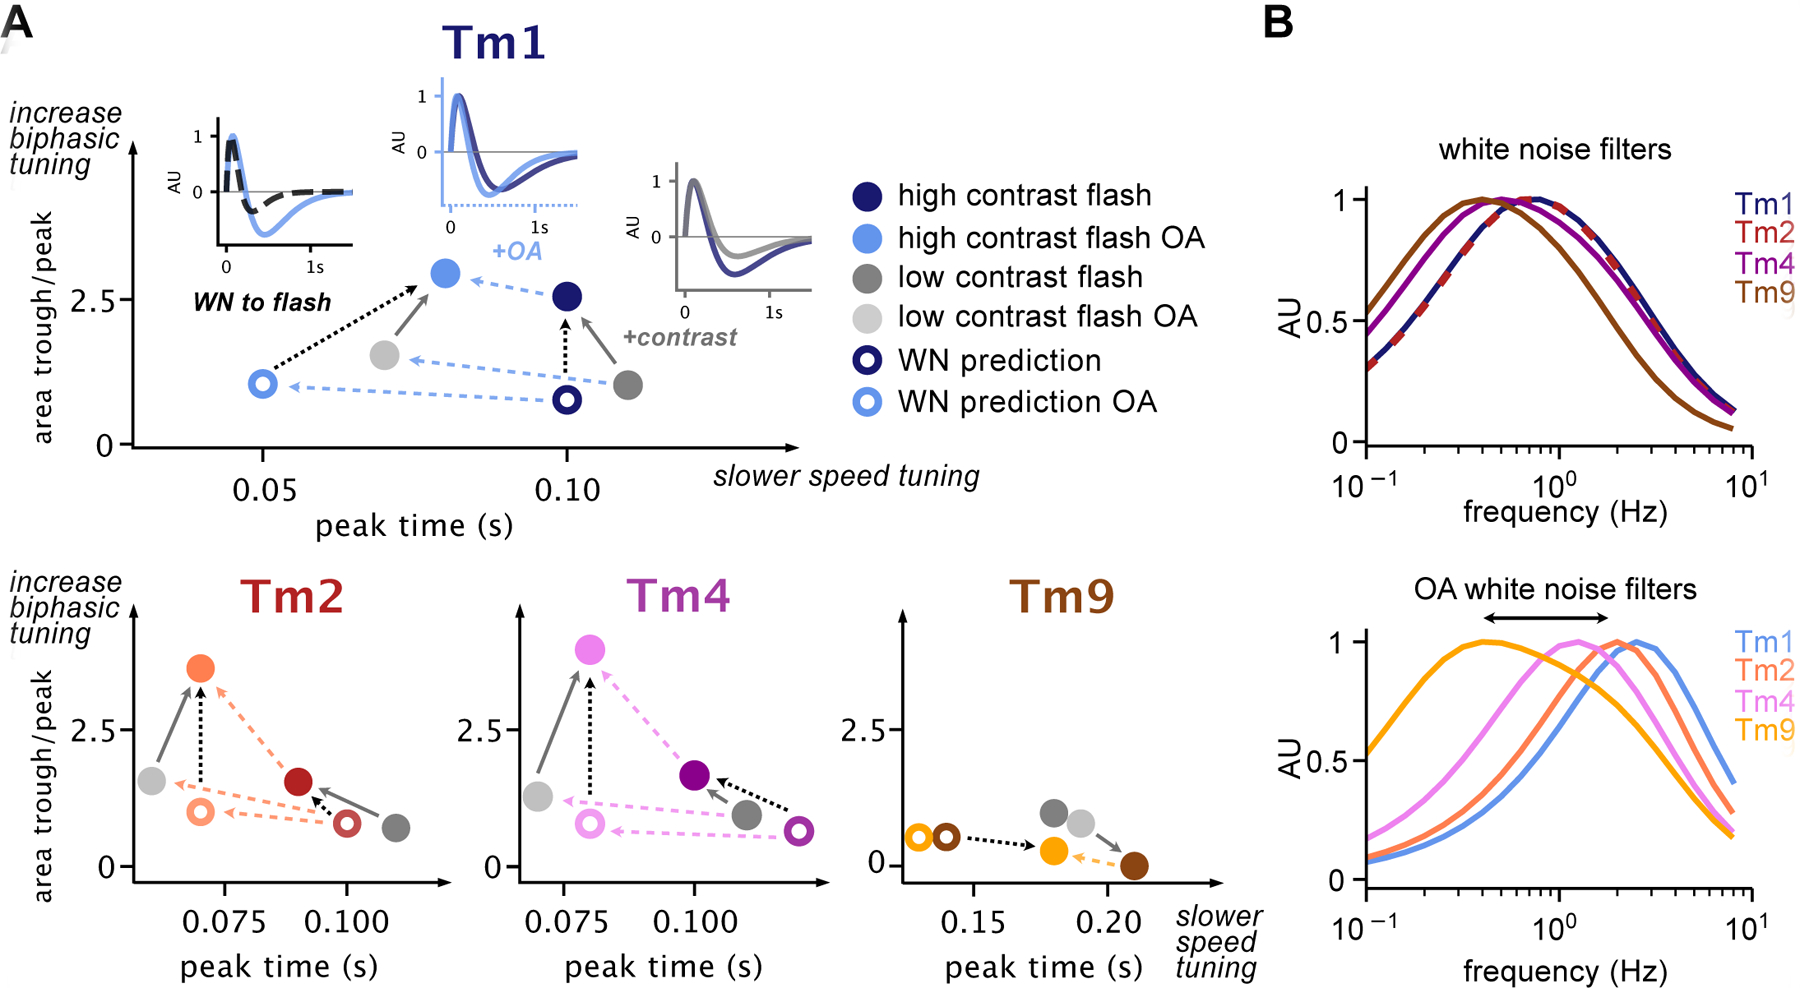
Figure 4: Tm1, Tm2, Tm4 and Tm9 temporal responses move within a parameter space.

A. ratio of the area of the peak lobe with respect to the trough lobe (biphasic tuning) as a function of peak time (speed tuning) of parameterized responses of Tm1, Tm2, Tm4 and Tm9 to 160 ms flashes across conditions, including high contrast and high contrast OA (solid colored filled circles), low contrast and low contrast OA (grey filled circles), and baseline and OA white noise filter predictions for 160 ms stimuli (colored circles). For Tm1, example traces are included in insets comparing (i) White noise OA prediction and high contrast flash in OA, (ii) high contrast flashes with and without OA, and (iii) low and high contrast flashes. Solid grey, dashed black and dashed blue lines indicate corresponding trends in biphasic and speed tuning driven by OA or stimulus. B. Frequency tuning of parameterized filters obtained in saline (top) and in OA (bottom). Tm1/Tm2/Tm4 filters in OA become more band-pass (respond to a narrower range of frequencies), and shift their peaks to higher frequencies. Additionally, Tm1/Tm2/Tm4/Tm9 become more distinct in the frequency range each cell responds to. See also Figure S4.
