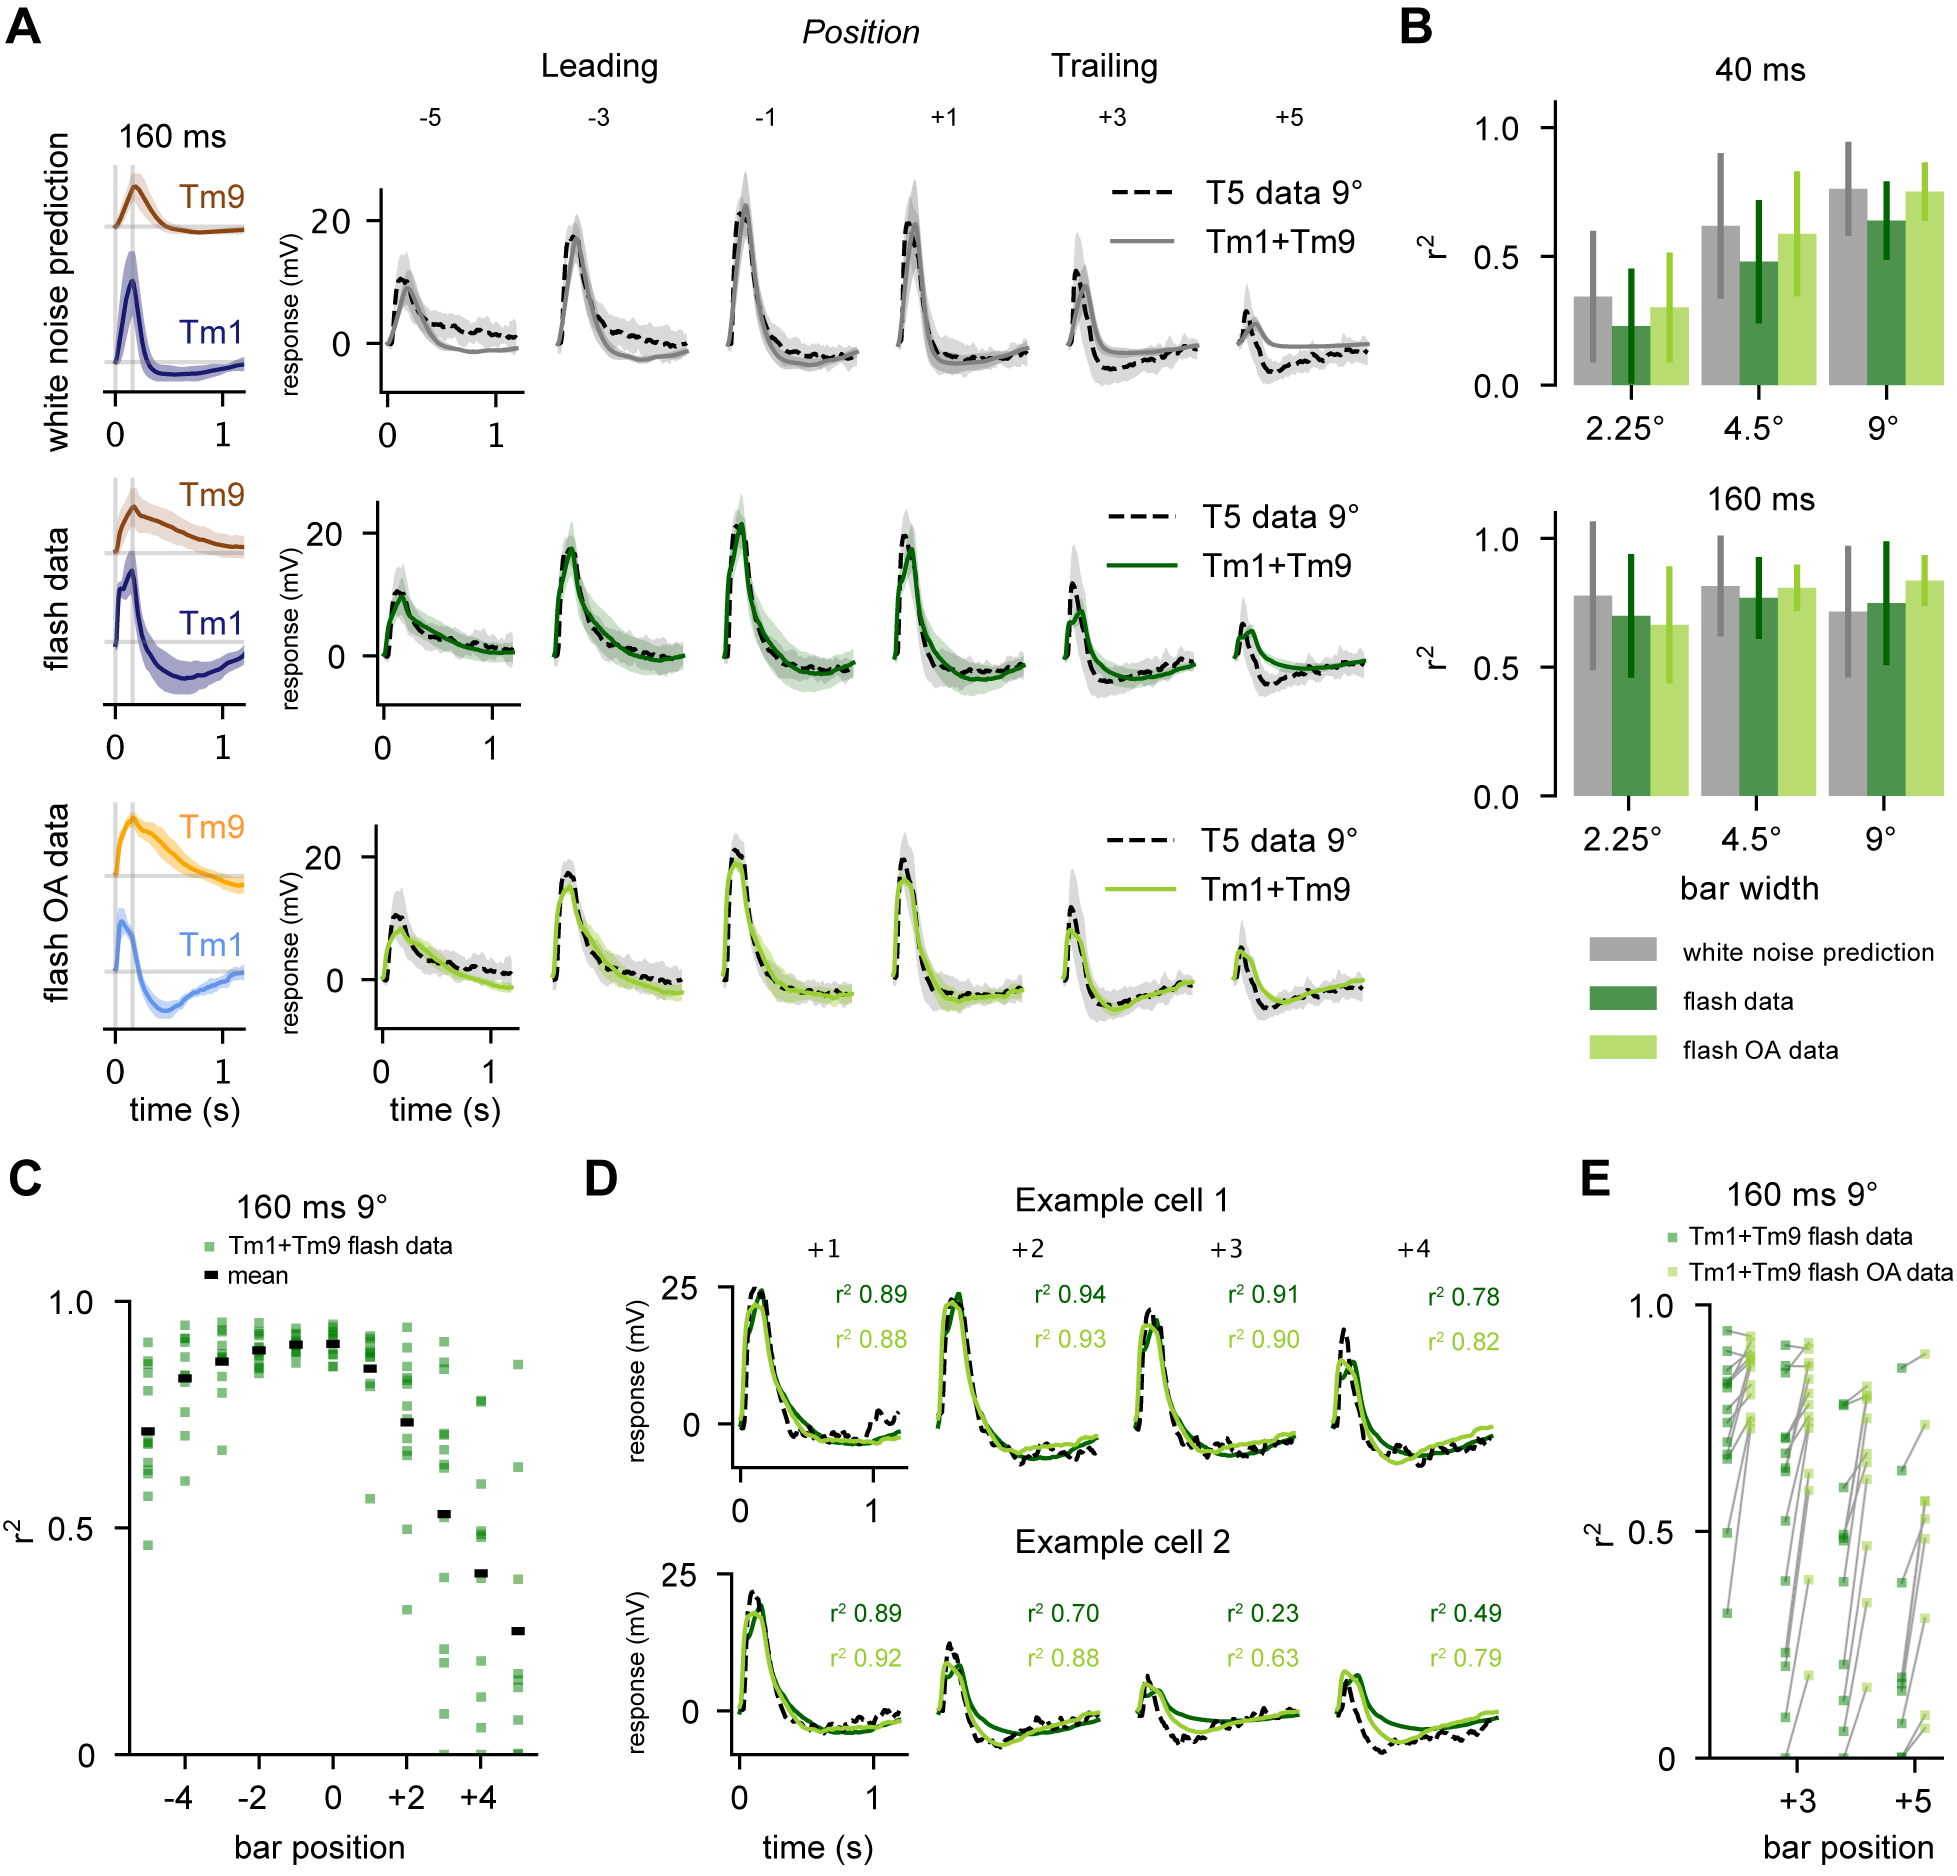
Figure 5: The sum of adaptive columnar inputs predicts T5 flash responses.

A.Top: White noise extracted filters are convolved with 160 ms stimulus and then fit with linear regression to T5 electrophysiological recordings from Gruntman et al. [6] for the 160 ms, 9° bar condition, at various positions in the receptive field of T5 (data dashed line, fit solid grey line). T5 average traces shown for bar position from “Leading” edge (−5, −3, −1) and “Trailing” edge (+1, +3, +5). Middle: Average Tm1 and Tm9 responses to 160 ms flashes are fit via linear regression to each T5 recording from Gruntman et al. [6] for the 160 ms, 9° bar condition (data dashed line, fit solid dark green line) Bottom: Same as Middle using Tm1 and Tm9 160 ms flashes in the presence of OA (data dashed line, fit solid line). Linear regression using flash responses and flash responses recorded in OA provides a good fit to T5 data. This is especially evident in the trailing edge (bar positions +3 and +5). B. Aggregate r2 values (square of sample correlation coefficient, see STAR Methods) across bar positions for linear regression fits of Tm1+Tm9 to Gruntman et al.12 recordings of T5 (conditions: 40 and 160 ms presentations of 2.25°, 4.5°, and 9° bars). Error bars depict standard deviation C. Distribution of r2 values across bar positions for fits to individual T5 responses to 160 ms, 9° bars. D. Example traces of fits to two single cells from C (T5 data, black dashed line; fits using saline flashes, dark green; fits using OA flashes, light green). E. Using the highly biphasic Tm1/Tm9 flashes recorded in OA improves the r2 of fits on the trailing edge of the T5 receptive field, where asymmetric hyperpolarization is most evident. See also Figure S5.
