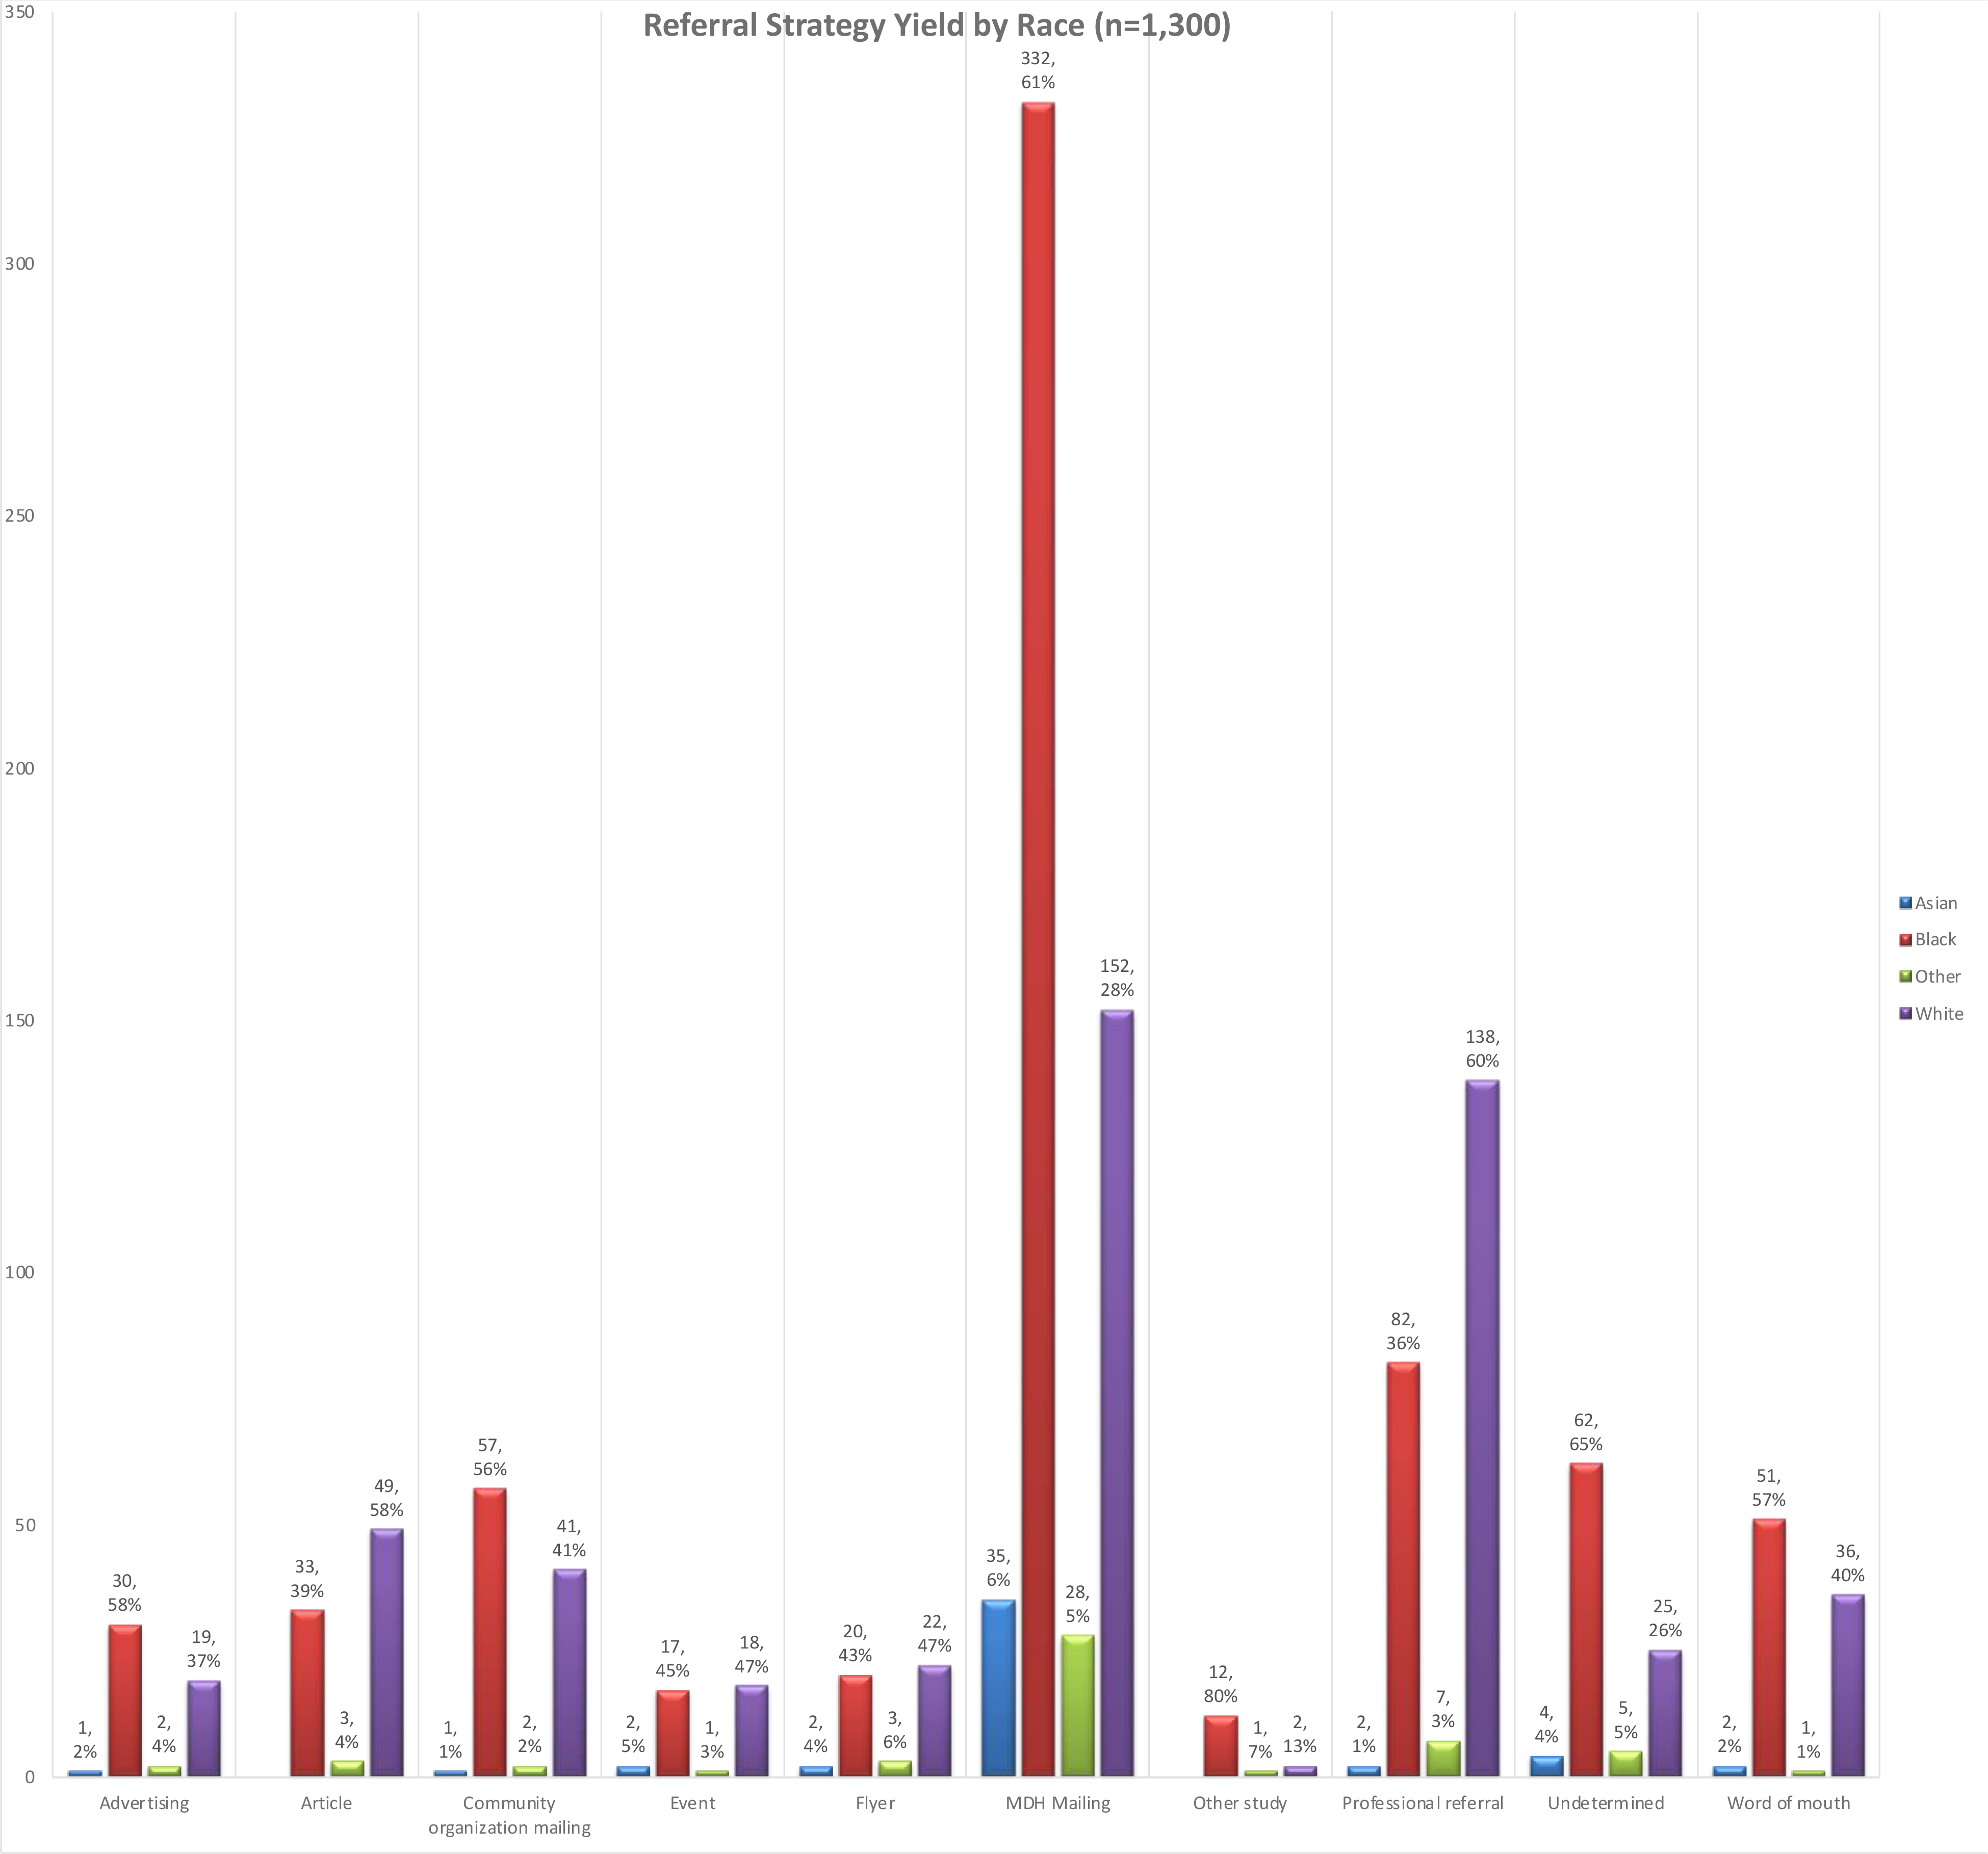
Figure 3. Referral Yield by Recruitment Strategy and Race (n=1,300).

Figure 3 shows the yield of several recruitment strategies by race of referral, detailing the percentage within that strategy category. Several ineffective strategies, which were those with 22 or fewer referrals or a total of 3% of referrals, are excluded. This excluded a total of 58 referrals that came from: Departments of Aging mailings, care partner-initiated emails to the study account, referrals from existing participants, and study website. Missing data on race (n=691) also reduced the sample in this chart, particularly from the “undetermined” group or people who did not complete the screening.
