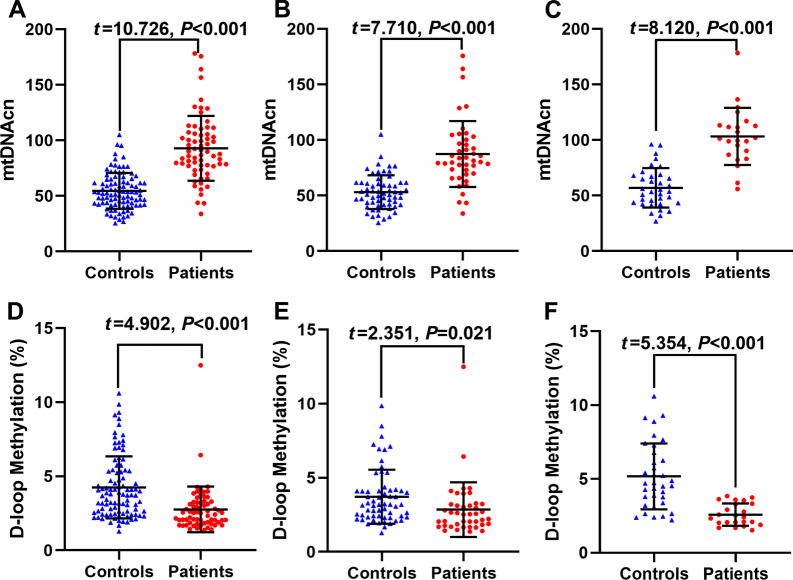
Fig. 1.
The differences of mtDNAcn and D-loop methylation levels between the CADASIL group and the control group. A In the total population, the mtDNAcn of the case group (92.94 ± 29.19) is higher than that of the control group (54.53 ± 16.18) (P < 0.001). B In the male population, mtDNAcn of the case group (87.42 ± 29.71) is higher than the control group (53.12 ± 15.19) (P < 0.001). C In the female population, mtDNAcn of the case group (103.27 ± 25.73) is higher than the control group (56.99 ± 17.73) (P < 0.001). D In the total population, D-loop methylation of the case group (4.25% ± 2.10%) is higher than the control group (2.76% ± 1.55%) (P < 0.001). E In the male population, D-loop methylation of the case group (2.85% ± 1.84%) is lower than the control group (3.72% ± 1.83%) (P = 0.021). F In the female population, D-loop methylation is lower in the case group (2.59% ± 0.75%) than in the control group (5.18% ± 2.23%) (P < 0.001). All tests were performed using two independent sample t tests: long bar for mean and short bar for standard deviation

