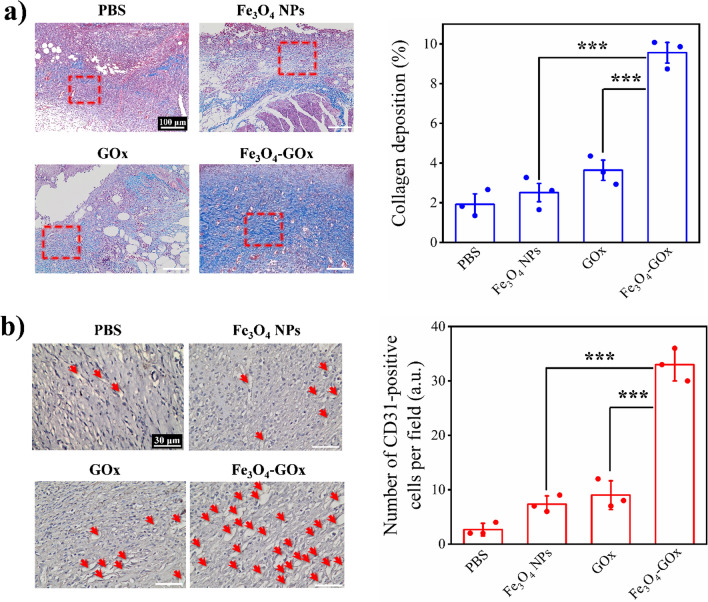
Fig. 7.
Collagen deposition and blood vessel formation in DU wound under different treatment. a Representative Masson’s trichrome staining images and the corresponding quantitative data of collagen deposition percentage of the tissues of MRSA biofilm-infected diabetic wound in four treatment groups. The red rectangle parts in the images are magnified in Additional file 1: Fig. S17 to show the condition of fiber alignment. b Representative CD31 staining images and the corresponding quantitative data of the CD34-positive cell’s number of the tissues of MRSA biofilm-infected diabetic wound in four treatment groups indicate the condition of blood vessel formation. In a and b, the values of collagen deposition percentage and CD31-positive cell’s number determined using 9 staining images from three independent experiments are stated as mean ± SD. ***P < 0.001

