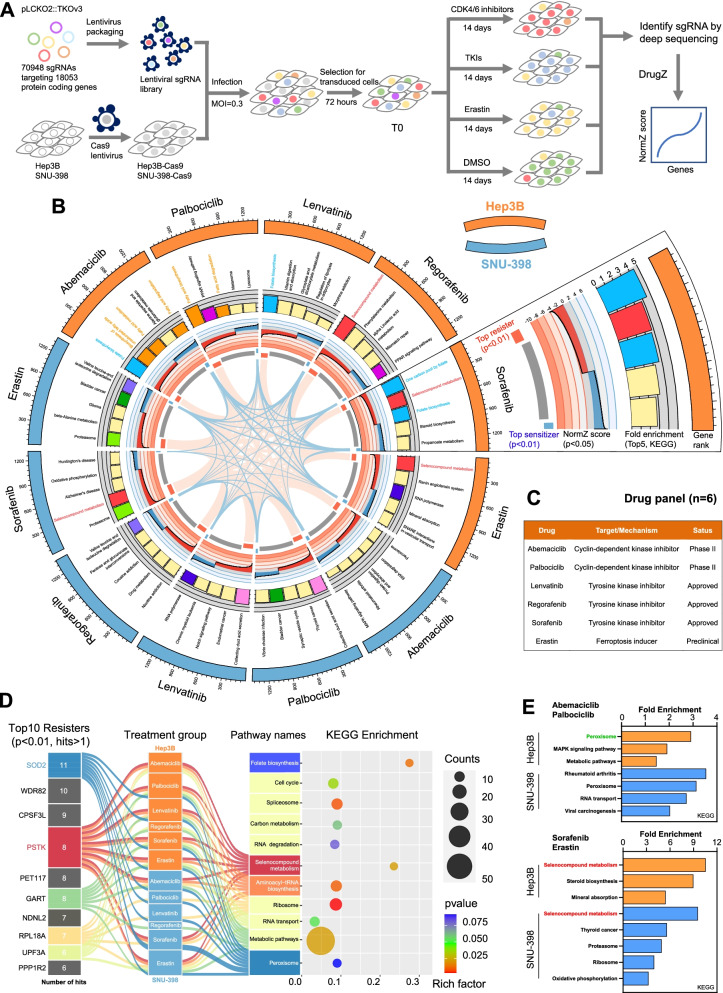
Fig. 1.
CRISPR/Cas9 screening identifies driver genes associated with HCC cell resistance to targeted therapy. A Schematic overview of the CRISPR/Cas9 knockout library screening strategy used in this study. B Circos plots displaying CRISPR screen results. Significant screen hits are ranked on the outermost rim (p<0.05) from most sensitizing to most resistance-associated. Histograms and corresponding annotations summarize enriched KEGG pathways for ranked genes, with similar pathways being marked using the same color. Line plots display NormZ scores for ranked genes, with the innermost rim demonstrating the top resister hits (red, p<0.01), top sensitizer hits (blue, p<0.01), and inner (grey). Gene-gene relationships between different treatment groups and different cell lines are indicated with links. C A drug panel with information regarding the names, mechanisms of action, and clinical status of drugs used in this study. D A Sankey plot demonstrating the relationships among top treatment resistance-related genes, treatment groups, and top KEGG enrichment pathways. Top resistance genes (p<0.01) detected in at least two treatment groups (>1 hits) were used for KEGG enrichment analyses. E Subgroup KEGG enrichment analyses for significant hits derived from screening results (upper: the intersection between the Abemaciclib and Palbociclib treatment groups; lower: the intersection between the Sorafenib and Erastin treatment groups)

