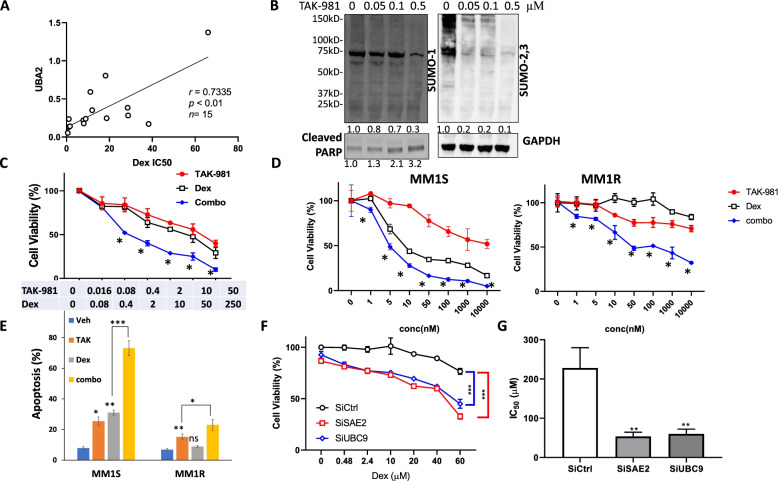
Fig. 1.
SUMOylation inhibition synergizes with Dex in decreasing cell viability in primary multiple myeloma cells and MM cell lines. A SAE2 expression is associated with Dex sensitivity in primary MM cells. SAE2 (UBA2) mRNA expression was assessed by q-PCR and presented as relative level normalized to GAPDH. IC50 values were calculated by GraphPad Prism 8. Pearson correlation analysis showed a significant positive correlation between SAE2 mRNA and IC50 for Dex in 15 primary MM. B TAK-981 inhibits global SUMOylation and induces cleaved PARP in MM1S cells. Western blot presents SUMO-1, SUMO-2,3-modified protein in MM1S cells after exposure to TAK-981 at the indicated concentrations for 16 h. GAPDH serves as loading control. Relative protein level was quantified and labeled below each blot. C Cell viability assay showing 1 of 6 primary CD138+ cells from bone marrow aspirates of MM patients treated with TAK-981 or Dex or both (combo) with indicated concentration. Cell viability was assessed by Cell-Titer-Glo after 48 h of treatment. *Combination Index (CI) < 1 determined by CompuSym. D TAK-981 synergizes with Dex cytotoxicity in sensitive line (MM1S) and resistant line (MM1R). MM1S and MM1R cells were treated with indicated concentration of TAK-981 or Dex or both (combo) and cell viability was determined by Cell-Titer-Glo post-48 h treatment. *Combination Index (CI) < 1 determined by CompuSym. E TAK-981 enhances cytotoxicity of Dex in sensitive and resistant MM. MM1S and MM1R cells were treated with Vehicle (Veh), 0.1 μM TAK-981 (TAK), 1 μM Dex (Dex), or 0.1 μM TAK-981 with 1 μM Dex (combo). Apoptosis was measured by flow cytometry using Annexin V/PI staining. F Knockdown of SAE2 and UBC9 enhances MM1R Dex sensitivity. MM1R cells were transfected with siRNA targeting SAE2 (SiSAE2) or UBC9 (SiUBC9), or non-targeting control (SiCtrl) for 48 h then treated with different concentration of Dex for 24 h. Cell viability was measured and normalized to untreated control cells. G IC50 values of Dex in MM1R cells calculated from data in F. Data were analyzed using unpaired Student t tests: Data presented as mean ± SD. ns, not significant; *, p < 0.05; **, p < 0.01; ***, p < 0.001

