Fig. 6.
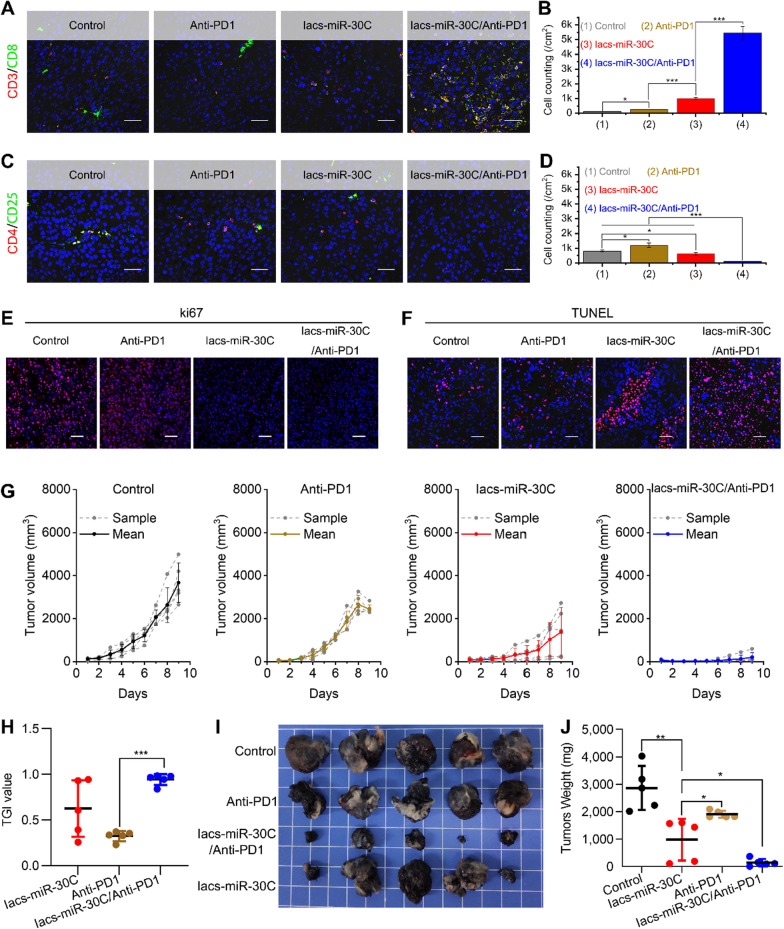
IacsRNA enhanceed anti-cancer activity of PD1 in C57 mice bearing B16F10 tumor. A, B Immunofluorescence images of CD3+/CD8+ cells (A) and quantification (B) in tumor sections from mice with the indicated treatments (scale bar: 50 μm). C, D Immunofluorescence images of CD4+/CD25+ cells (C) and quantification (D) in tumor sections from mice with the indicated treatments (scale bar: 50 μm). E, F Ki67 (E) and TUNEL (F) staining in tumor sections from mice with the indicated treatments (scale bar: 50 μm). G Growth curves of B16F10 tumors in C57 mice with the indicated treatments (n = 5). H Tumor growth inhibition (TGI) with the indicated treatment at day 9. I, J Representative photographs (I) and weight of tumor (J) after the indicated treatments. The data were presented as mean ± s.d. Statistical analysis was performed using t test, *, p < 0.05; **, p < 0.01; ***, p < 0.001

