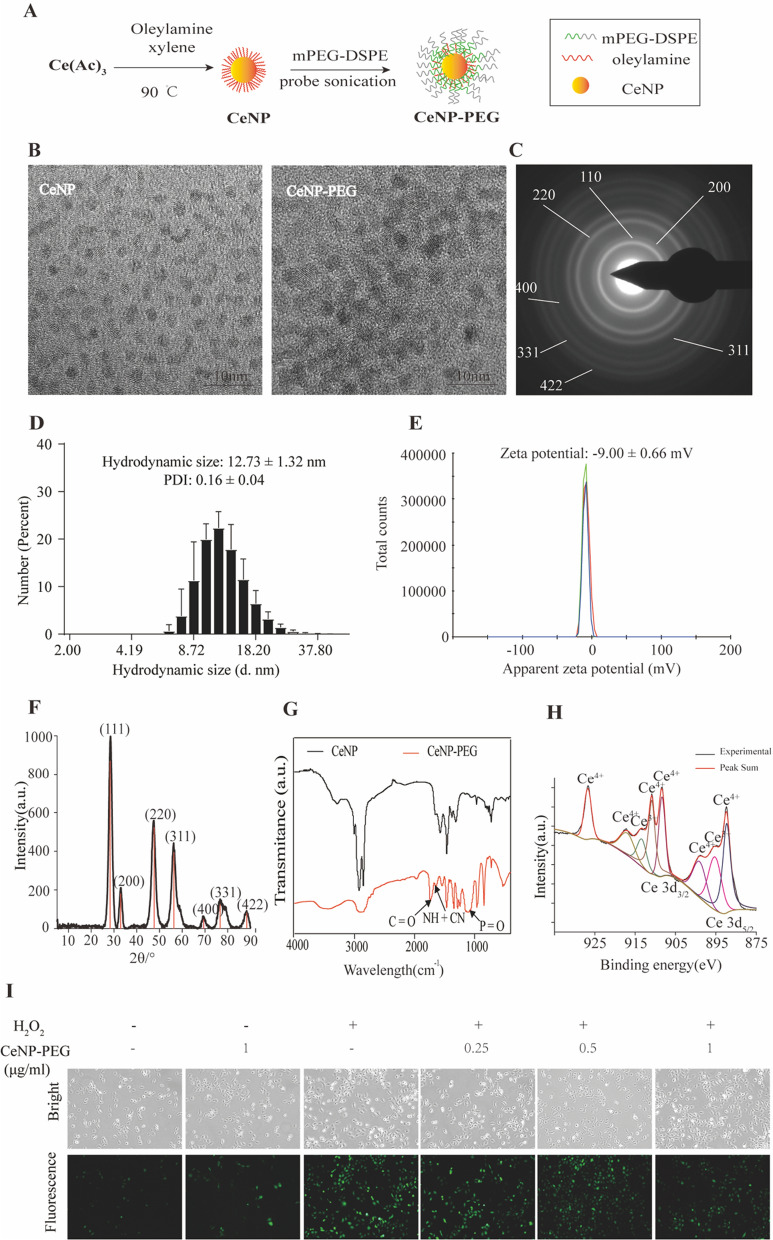
Fig. 1.
Synthesis and characterization of CeNP and CeNP-PEG. A Synthetic procedure of CeNP and CeNP-PEG. B Representative high resolution TEM images of CeNP and CeNP-PEG. The SAED C and XRD F images reveal the cubic fluorite structure of the CeNP. The hydrodynamic size D and zeta potential E of CeNP-PEG. G Fourier transform infrared (FT-IR) spectra of CeNP and CeNP-PEG. H The XPS spectra of ceria nanoparticles reveal the valence state and the corresponding binding energy peaks of 885.2 and 903.4 eV for Ce3+ and 882.3, 889.0, 898.4, 900.9, 907.0 and 916.8 eV for Ce4+. a.u.: arbitrary units. I Confocal images of extracellular ROS levels in the presence of CeNP-PEG treatments in HK-2 cells

