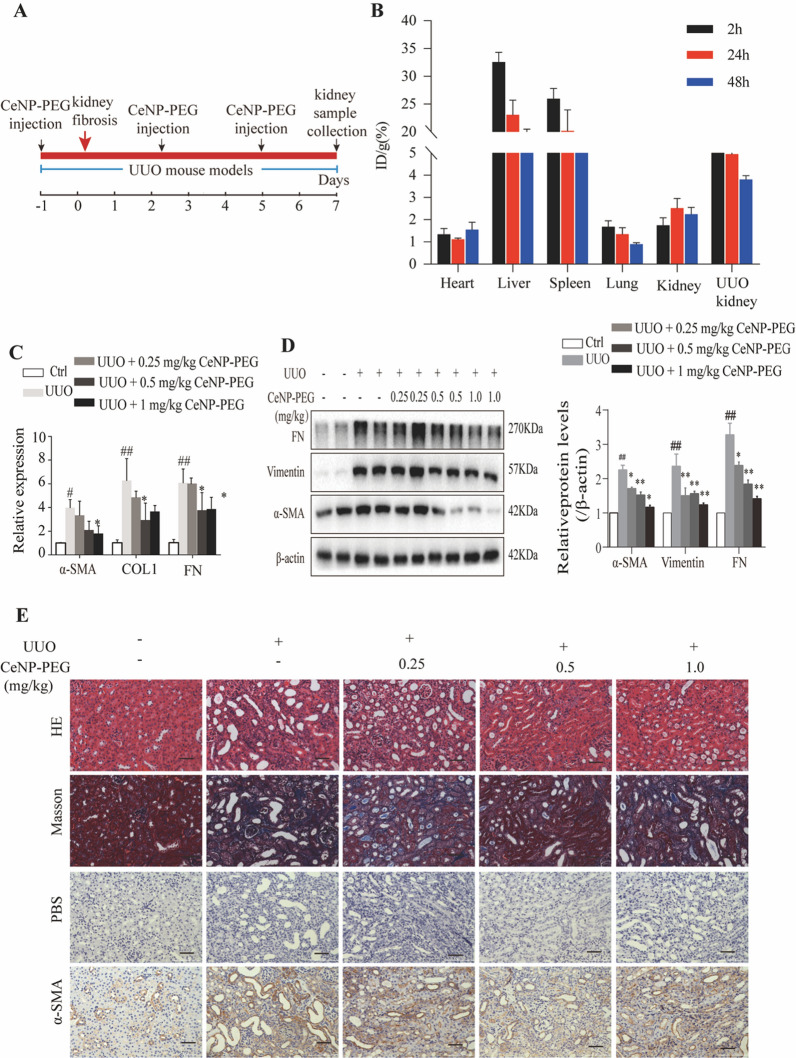
Fig. 2.
CeNP-PEG ameliorated renal fibrosis in UUO mice. A Schematic graph of the experimental design. B The biodistribution of CeNP-PEG in tissues of UUO mice. C The expression of α-SMA, COL1 and FN was evaluated by RT-PCR analysis. β-actin was used as the control (#P < 0.05 and ##P < 0.01 for UUO vs. control, and *P < 0.05 and **P < 0.01 for UUO vs. UUO + CeNP-PEG; n = 3 for each group). D The expression of α-SMA, Vimentin and FN was evaluated by western blot analysis. β-actin was used as the loading control (#P < 0.05 and ##P < 0.01 for UUO vs. control, and *P < 0.05 and **P < 0.01 for UUO vs. UUO + CeNP-PEG; n = 3 for each group). E The renal injury was evaluated by H&E staining. The renal fibrosis was evaluated by Masson trichrome and immunohistochemical analysis for the α-SMA expression. PBS was used as the negative control

