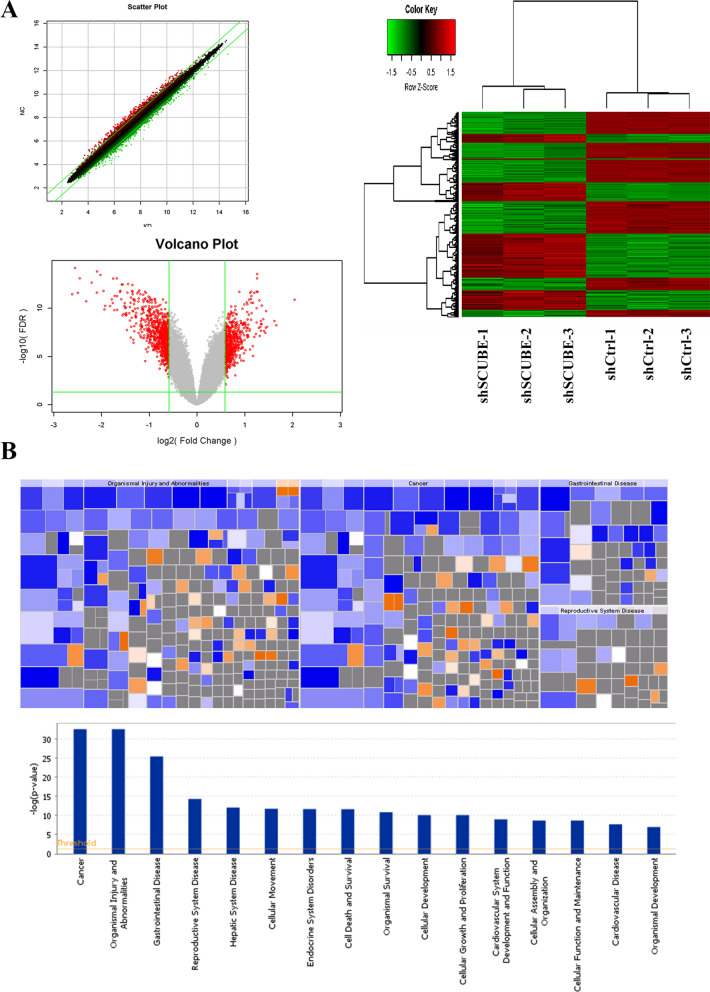
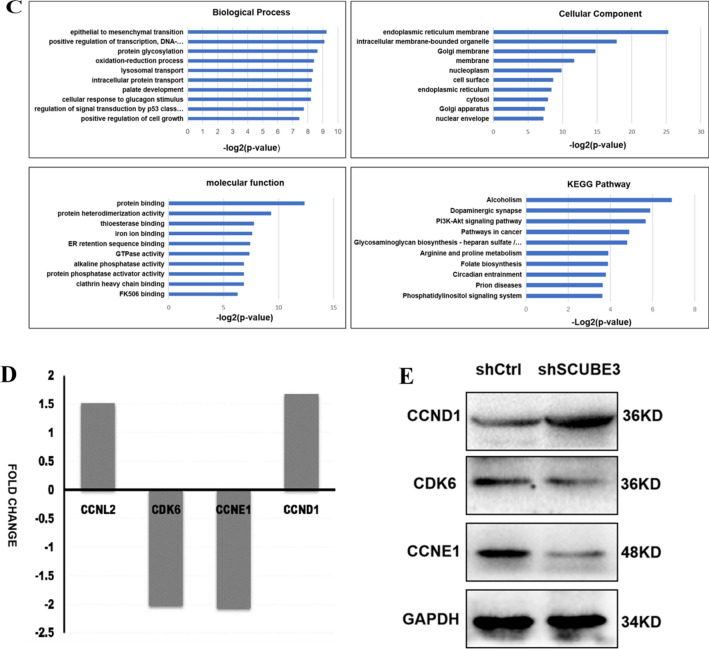
Fig. 4.
Affymetrix GeneChip microarray analysis and validation. A Analysis of significant differences according to the screening criteria of fold change |> 1.5| and false discovery rate (FDR) < 0.05. Scatter plot, volcano plot, heat map were constructed based on the genes differentially expressed between the control and SCUBE3-knockdown cells. B Disease and functional enrichment analysis of differential genes by IPA. The heat map of disease and function showed the relationship between the activation and inhibition of disease and function by the change of differential gene expression level. Orange indicates that the disease or functional state is activated (Z-score > 0), blue indicates that the disease or functional state is inhibited (Z-score < 0), and grey indicates that the disease or functional state is not determined (Z-score cannot be calculated). According to the internal algorithm and standard of IPA, Z-score > 2 means that the disease or function is significantly activated, and Z-score <—2 means that the disease or function is significantly inhibited. The diseases or functions significantly activated include Organic death (Z-score = 3.247), morbidity or mortality (Z-score = 3.200), etc.The diseases or functions significantly inhibited included: viral infection (Z-score = − 3.110), invasion of cells (Z-score = − 2.933). Histogram of disease and functional enrichment analysis statistics. C Significant GO terms associated with SCUBE3 knockdown in HCC cells.Analysis of cellular component (GO-CC), Analysis of biological process (GO-BP). Analysis of molecular function (GO-MF). KEGG Pathway enrichment. D Four genes associated with cell cycle regulation were screened by the microarray Chip analysis following the screening criteria. E The expression levels of three proteins (CCNE1, CCND1, CDK6) were verified by WB


