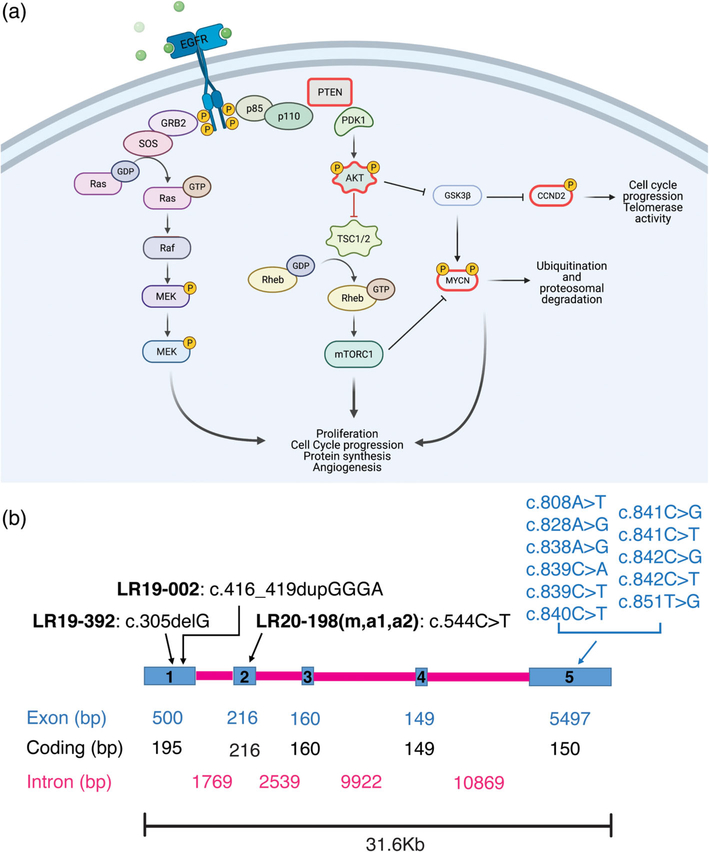
FIGURE 1.
CCND2 gene diagram and role in cell signaling. (a) A schematic representation of the PI3K-AKT-MTOR pathway and its’ interaction with the CCND2 protein. Proteins outlined in magenta are the ones with known gain of function and loss of function mutations leading to opposite phenotypes (PTEN, AKT3, MYCN, CCND2). Created with BioRender.com. (b) Scheme of the human CCND2 gene (Homo sapiens chromosome 12, GRCh38.p12 CCND2: NC_000012.12 mRNA NM_001759.4 protein NP_001750.1). Blue rectangles represent exons (1–5), while magenta lines represent introns. Exon, coding and intron base pairs length (bp) is shown in the relative colors. Above the gene scheme, putative CCND2 loss of function (LOF, in black) reported here, and previously published gain of function (GOF, in blue) mutations are reported

