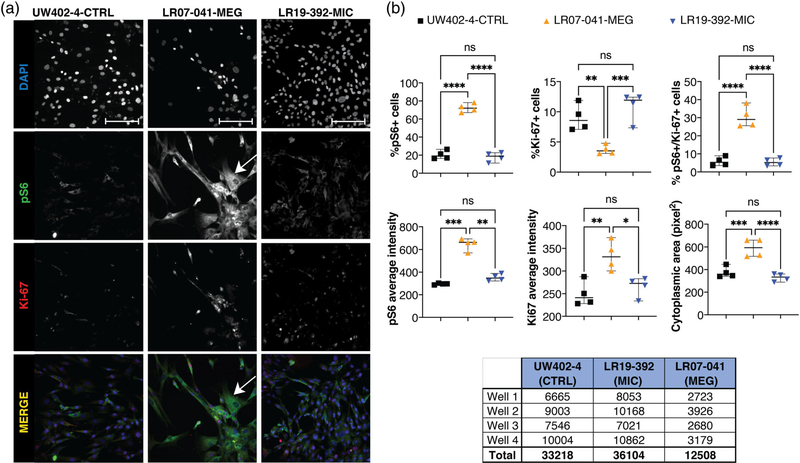
FIGURE 4.
High-content imaging on fibroblast cell lines with CCND2 MIC and MEG mutations. Fibroblast cell lines from one control (UW402–4-CTRL), one CCND2 MIC (LR07–041-MIC), and one CCND2 MEG (LR19–392-MEG) patients were plated in an optical 96 well plate (4 replicates each) and immunostained for proliferation marker Ki-67 and MTOR hyperactivation marker pS6; nuclei were counterstained with DAPI. Image acquisition and quantification was performed using the high-content imaging platform CellInsight CX7 LZR and the HCS studio software. (a) Single channel and overlay immunofluorescence images of one representative field per well per cell line are shown (20× magnification, scale bar 100 μm). For LR07–041-MEG, a hypertrophic fibroblast is indicated by the white arrow. (b) Quantification of the cells analyzed (4 wells per cell line, 15 fields per well) using the HCS software. Each value represents the average per well per cell line. In each graph and for each cell line, the thick bar represents the median, and the error bars represent the 95% confidence interval. One-way ANOVA analysis with multiple comparison was performed using GraphPad Prism software. Ns, nonsignificant; *p-value < 0.05; **p-value < 0.01; ***p-value < 0.0001; ****p-value < 0.00001. LR07–041-MEG shows increase in the percentage of pS6+ and ps6/Ki-67+ cells, with a reduction of Ki-67+ cells. The same line also presented increased intensity (level of expression) for pS6 and Ki-67, as well as increased cytoplasmic area. LR19–392-MIC did not show any significant difference when compared to the control. The table below panel B lists the number of cells analyzed per well per cell line, and the relative total number of cells per cell line

