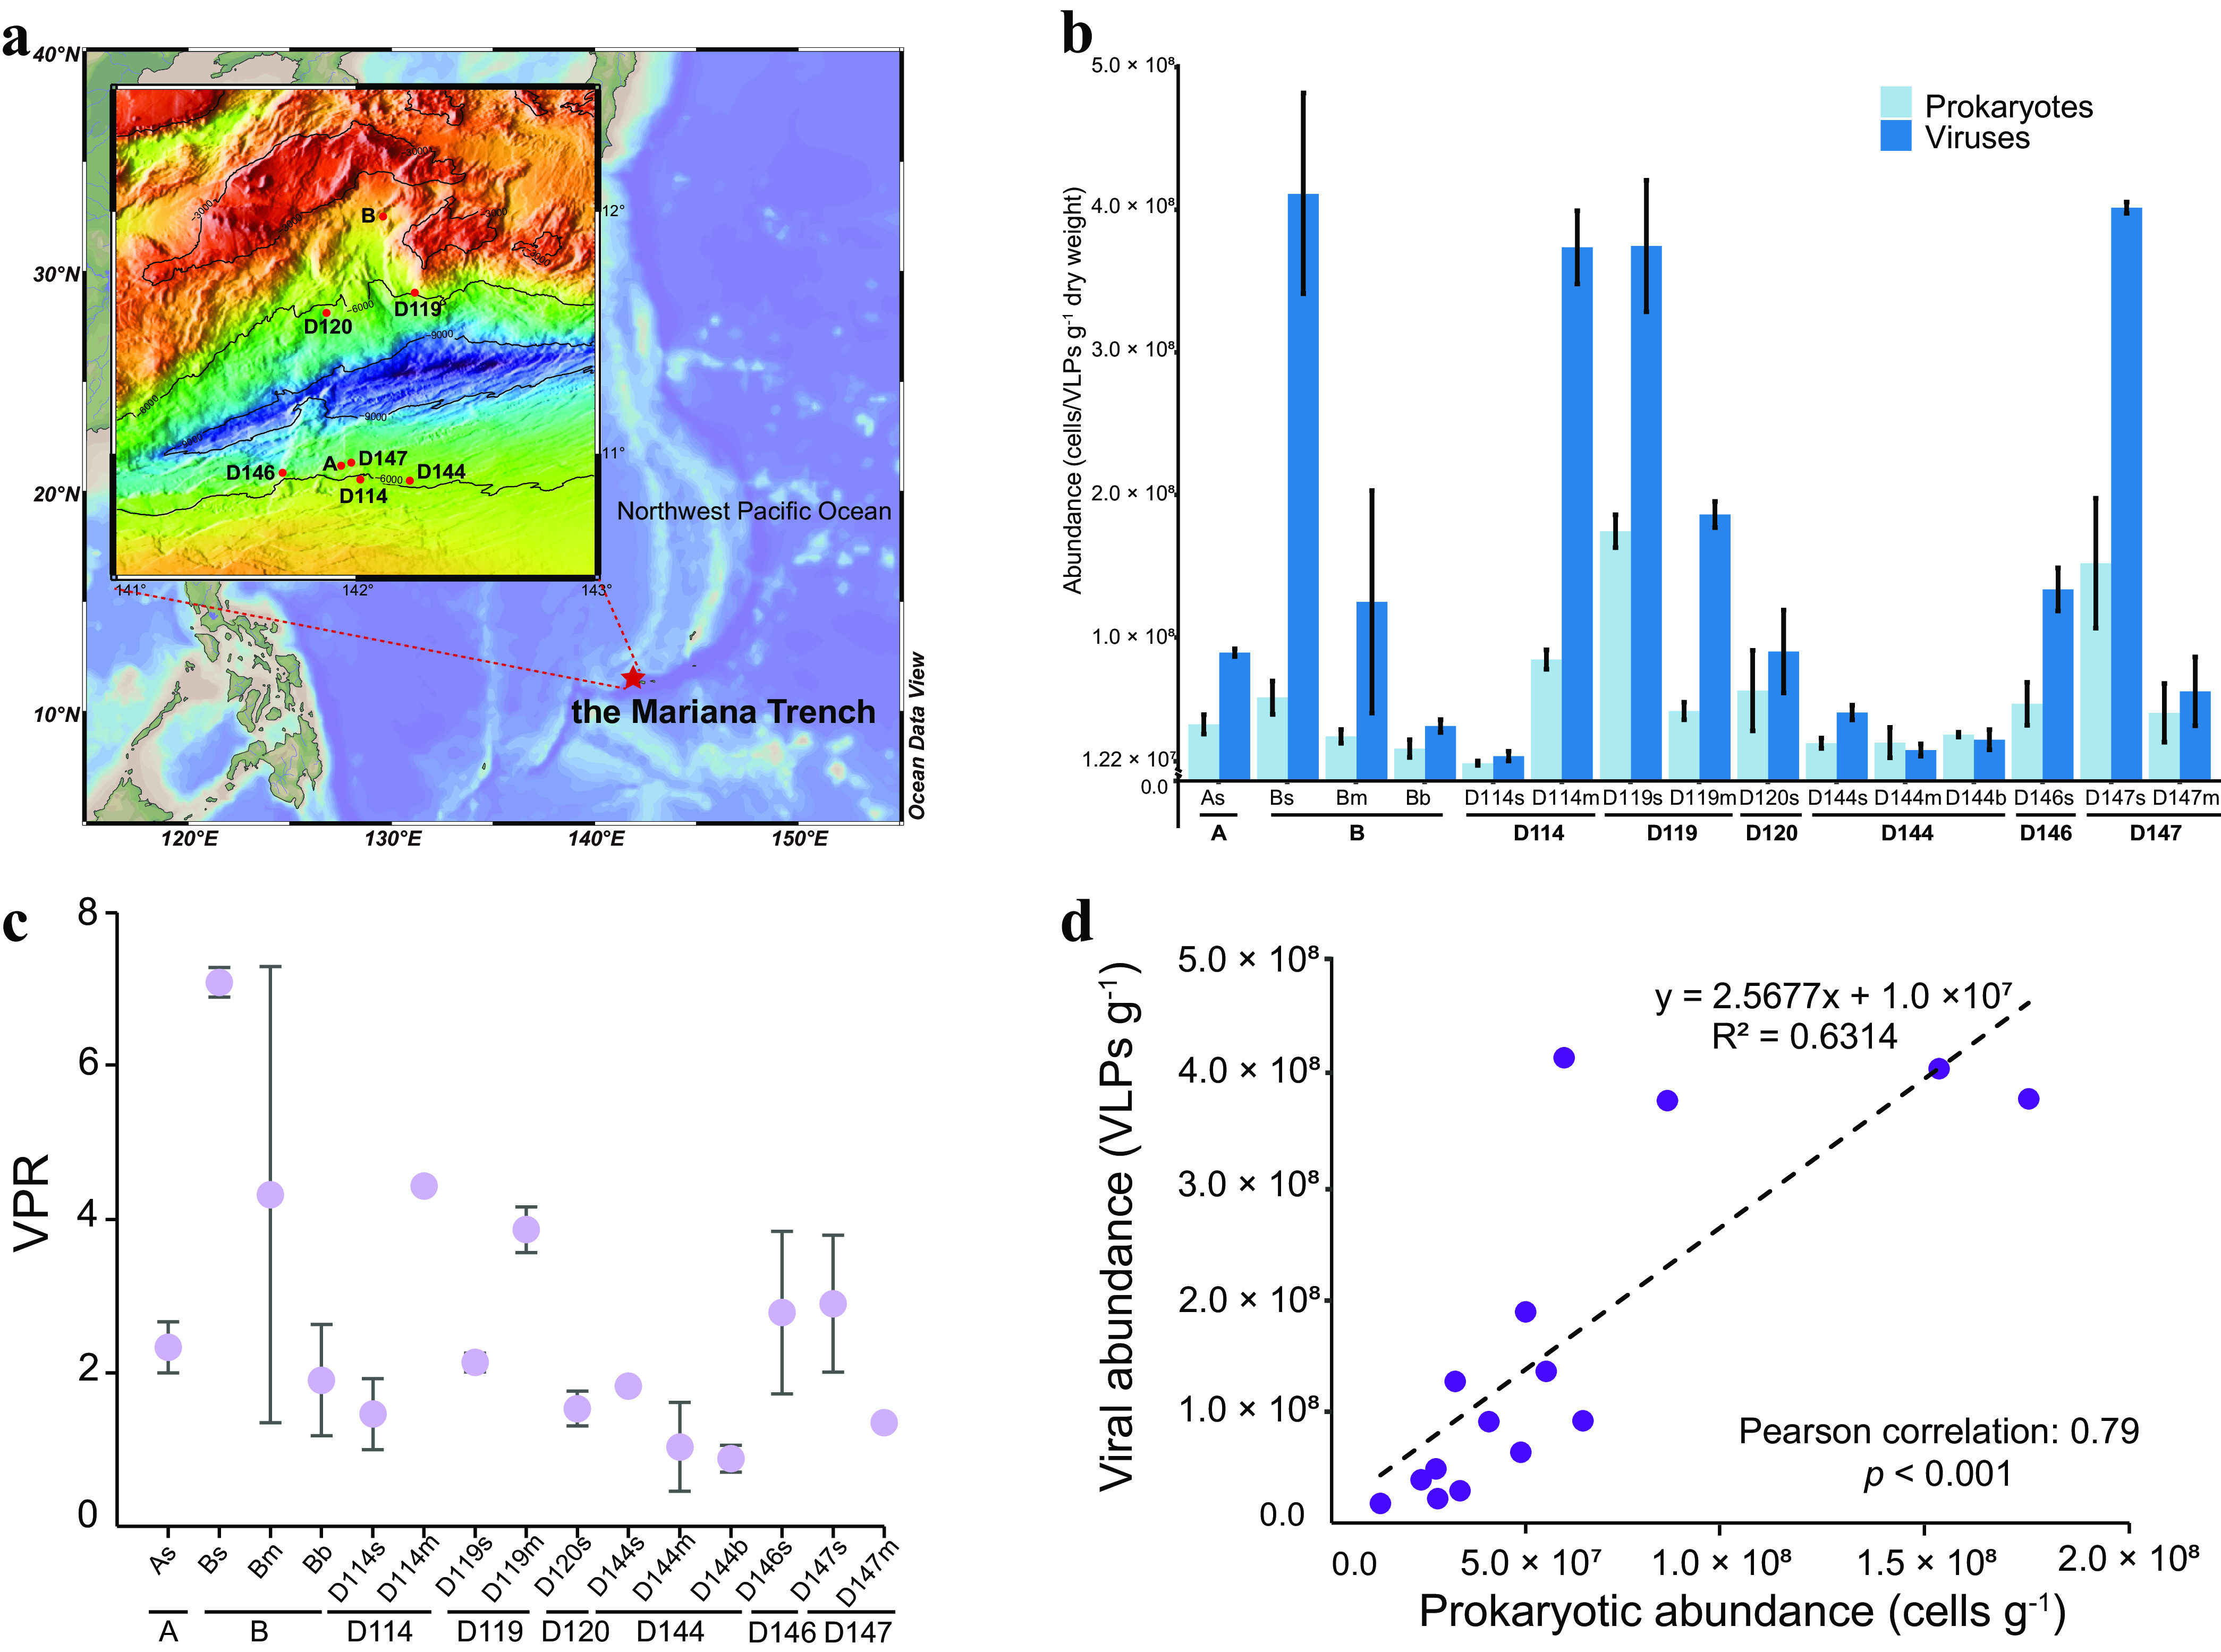
FIG 1.

Sampling locations and abundance profiles of the MTS viruses and prokaryotes. (a) Satellite image of the sampling location (red star) in the Mariana Trench of the Pacific Ocean and sampling sites and depths. (b) Enumerated abundances of viruses and prokaryotes in each sample. (c) Virus-to-prokaryote ratio (VPR) of each sample, calculated as the viral abundance divided by the prokaryotic abundance. For both panels b and c, “A, B, D114, D119, D120, D144, D146, and D147” represent different sampling sites, and the following “s,” “m,” and “b” represent the sediment samples collected from the pushcore of 0-6 cm (surface part), 6-12 cm (middle part), and 12-18 cm (bottom part), respectively (see Materials and Methods). (d) Relationship between prokaryotic and viral abundances in MTS (P < 0.001 by linear regression). In panels b and c, the data are shown as means ± standard deviations.
