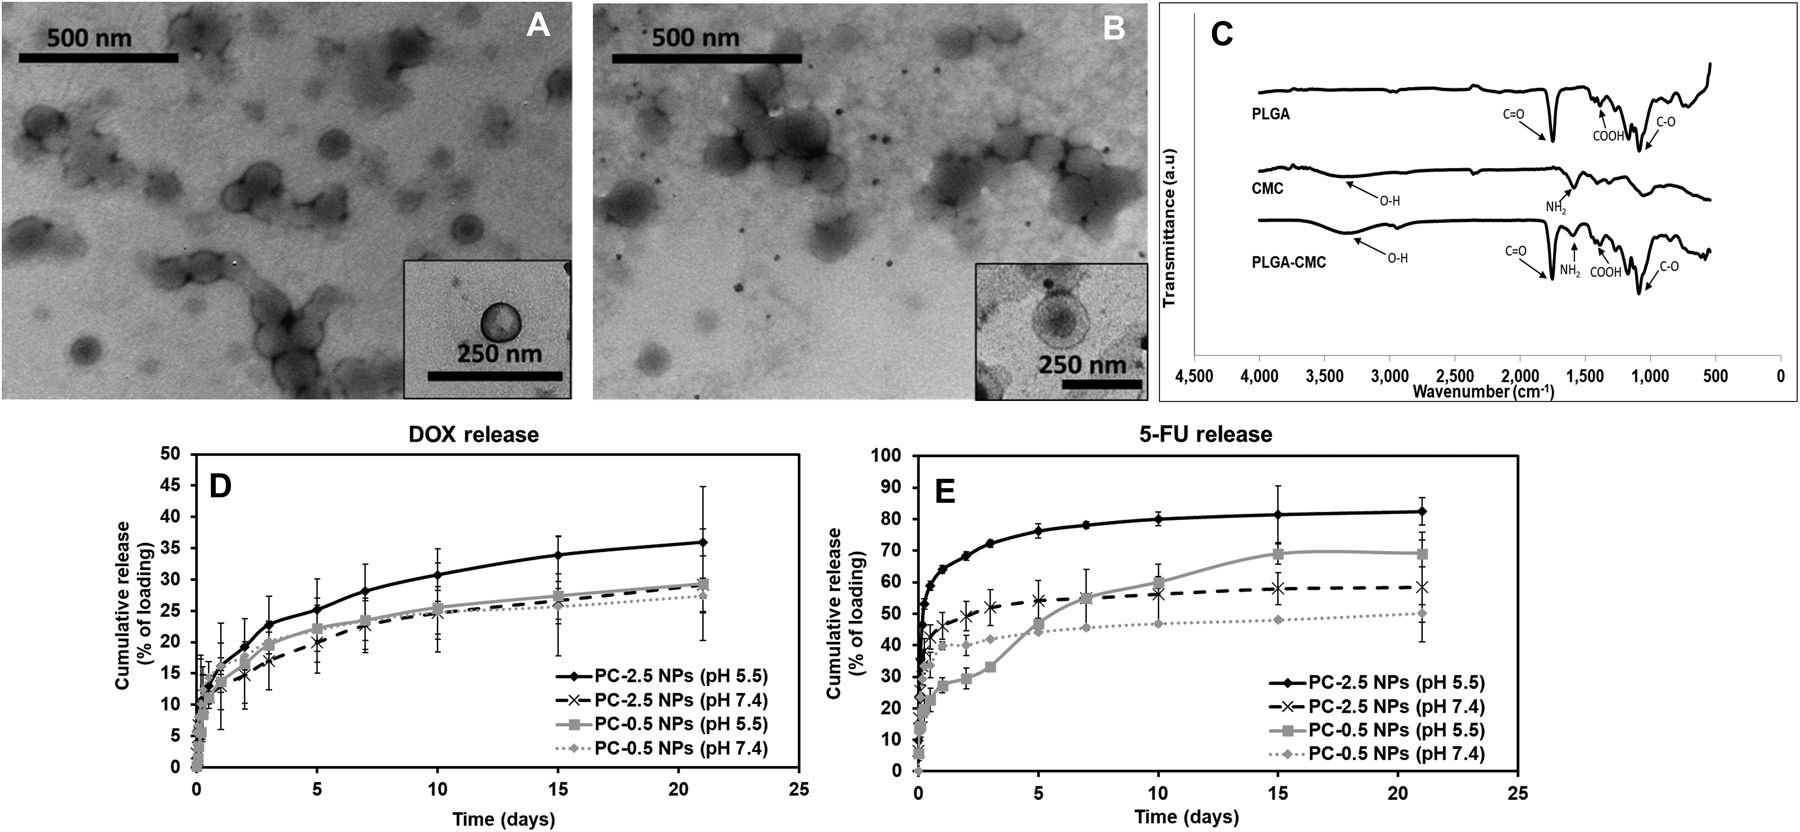
Figure 2:

NP characterization. TEM images showing core/shell structures of (A) PC-0.5 and (B) PC-2.5 NPs. (C) FTIR spectra confirming the incorporation of both CMC and PLGA in the PC-2.5 NPs. Release profile of (D) Dox and (E) 5-FU from PC-0.5 and PC-2.5 NPs at pH 5.5 and 7.4. Greater pH-dependent release was observed for PC-2.5 NPs than for PC-0.5 NPs. Lines represent mean values ± SD (n=4).
