Figure 2.

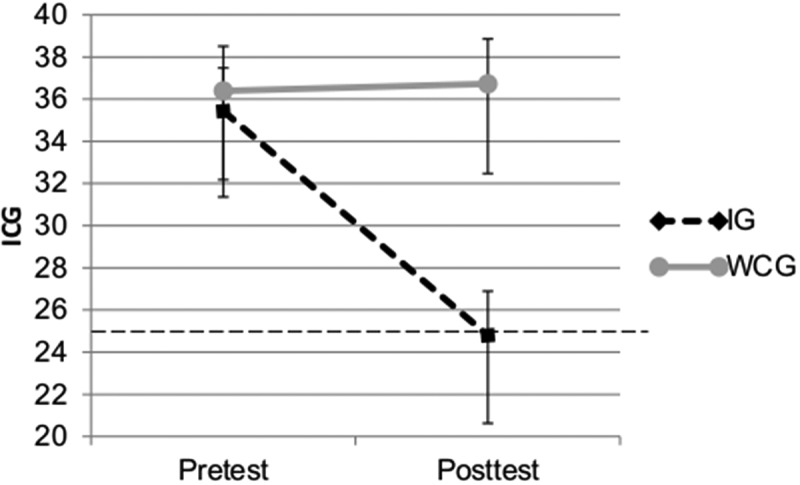
Time by group interaction effect for PGD symptoms measured with the ICG (means and 95% CI, ICG cut-off =25, possible range: 0-76)

Time by group interaction effect for PGD symptoms measured with the ICG (means and 95% CI, ICG cut-off =25, possible range: 0-76)