
Figures 1a and 1b (ONLINE).
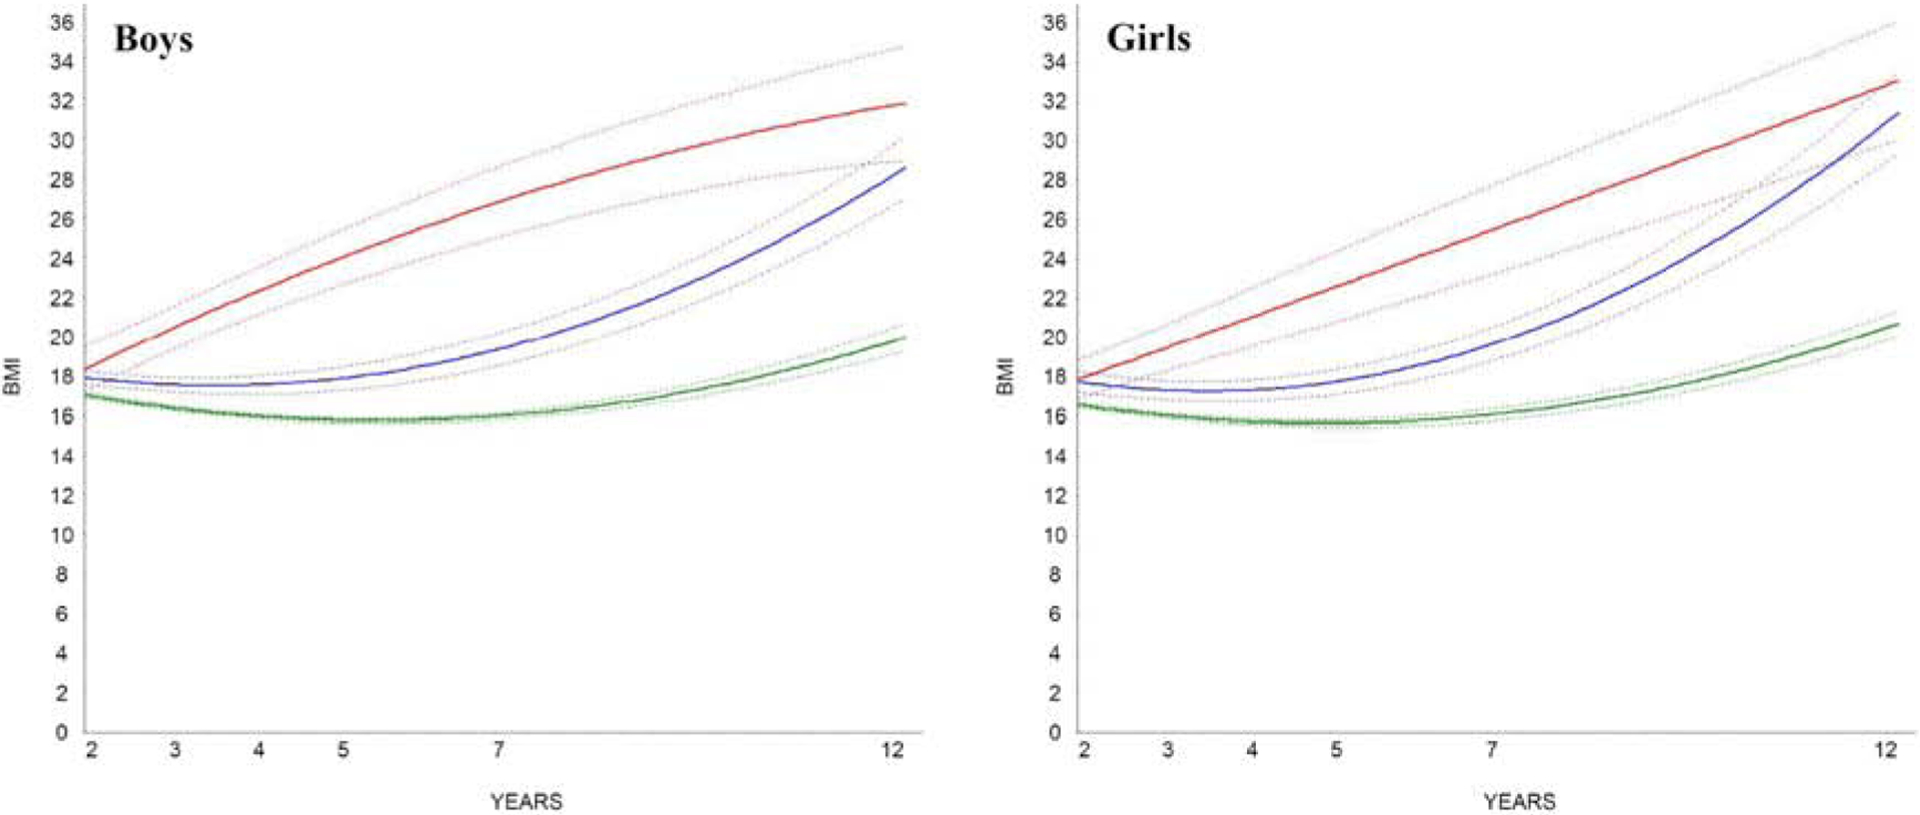
Growth mixture model solutions identifying BMI trajectories for boys and girls. Models were performed separately for boys and girls. Plotted solid lines represents estimated means; dashed lines are 95% confidence intervals.
 “Maintained Non-Overweight” (n=405, 75.6%) “Maintained Non-Overweight” (n=405, 75.6%) |
 “Maintained Non-Overweight” (n=392, 77.6%) “Maintained Non-Overweight” (n=392, 77.6%) |
 “Developed Obesity” (n=112, 20.9%) “Developed Obesity” (n=112, 20.9%) |
 “Developed Obesity” (n=74, 14.7%) “Developed Obesity” (n=74, 14.7%) |
 “Developed Severe Obesity” (n=19, 3.5%) “Developed Severe Obesity” (n=19, 3.5%) |
 “Developed Severe Obesity” (n=39, 7.7%) “Developed Severe Obesity” (n=39, 7.7%) |