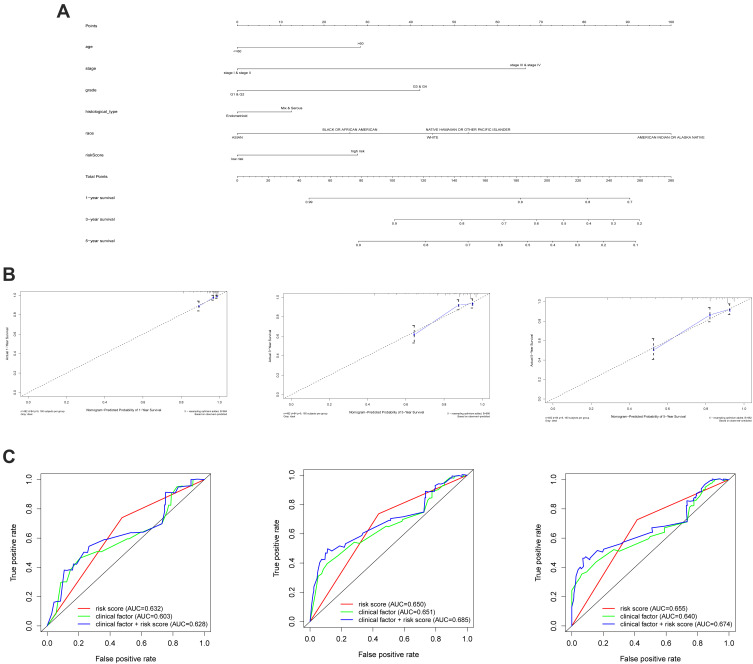
Figure 7.
The nomogram to predict 1-, 3‐ or 5‐year OS and prognostic value of hub genes. (A) The nomogram for predicting proportion of patients with 1-, 3‐ or 5‐year OS. (B) The calibration plots for predicting patient 1-, 3‐ or 5‐ year OS. Nomogram‐predicted probability of survival is plotted on the x‐axis; actual survival is plotted on the y‐axis. (C) 1-, 3‐ or 5‐ year ROC curve analysis of the hub genes according to risk score and clinical factors.

