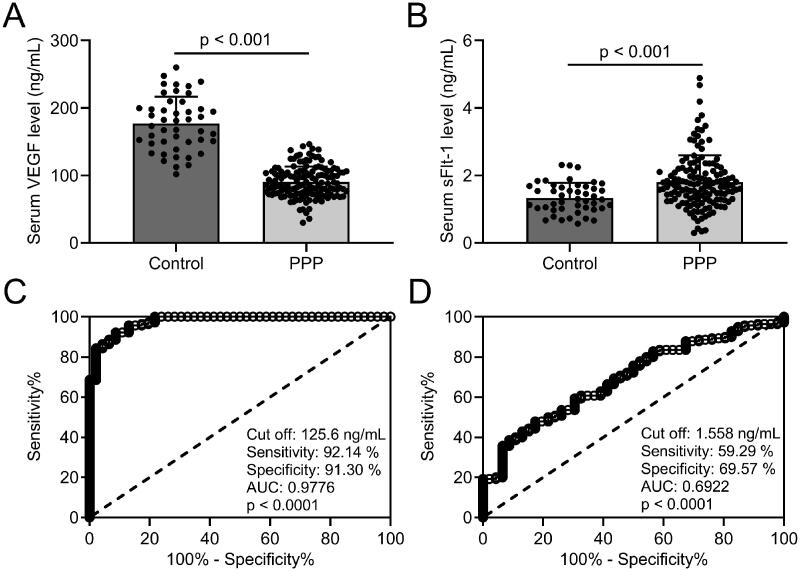
Figure 1.
Comparisons of serum VEGF and sFlt-1 between pernicious placenta previa (n = 140) and healthy controls (n = 46) and the diagnosis values of serum VEGF and sFlt-1 on pernicious placenta previa compared to healthy controls. ELISA was used to analyze the serum concentrations of VEGF (A) and sFlt-1 (B). Data are presented as mean ± SD or n (%). ***p < .001. ROC analysis of serum concentrations of VEGF (C) and sFlt-1 (D).

