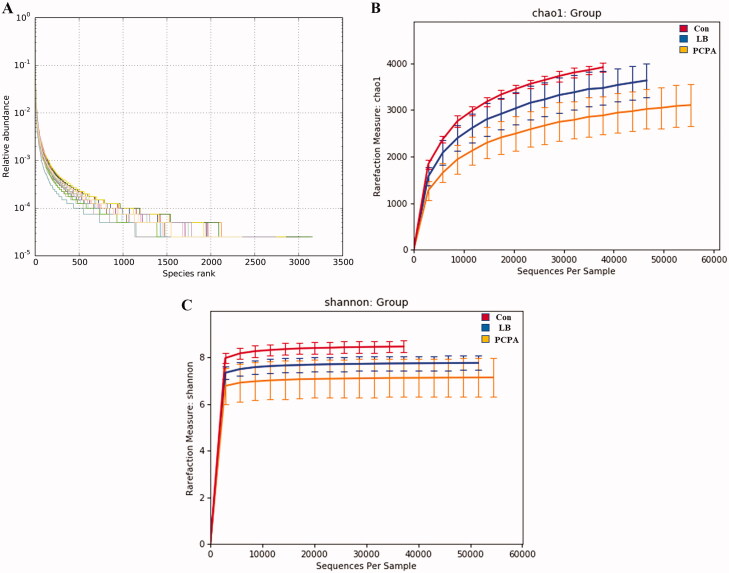
Figure 5.
Changes in the richness and diversity of intestinal flora caused by LB treatment. (A) The OTU rank abundance of the intestinal flora in rats. (B) Bacterial richness estimated based on the Chao 1 value; (C) Bacterial diversity estimated from the Shannon index. The red, blue and yellow curves represent the control, LB and PCPA groups, respectively.

