
Figure 3.
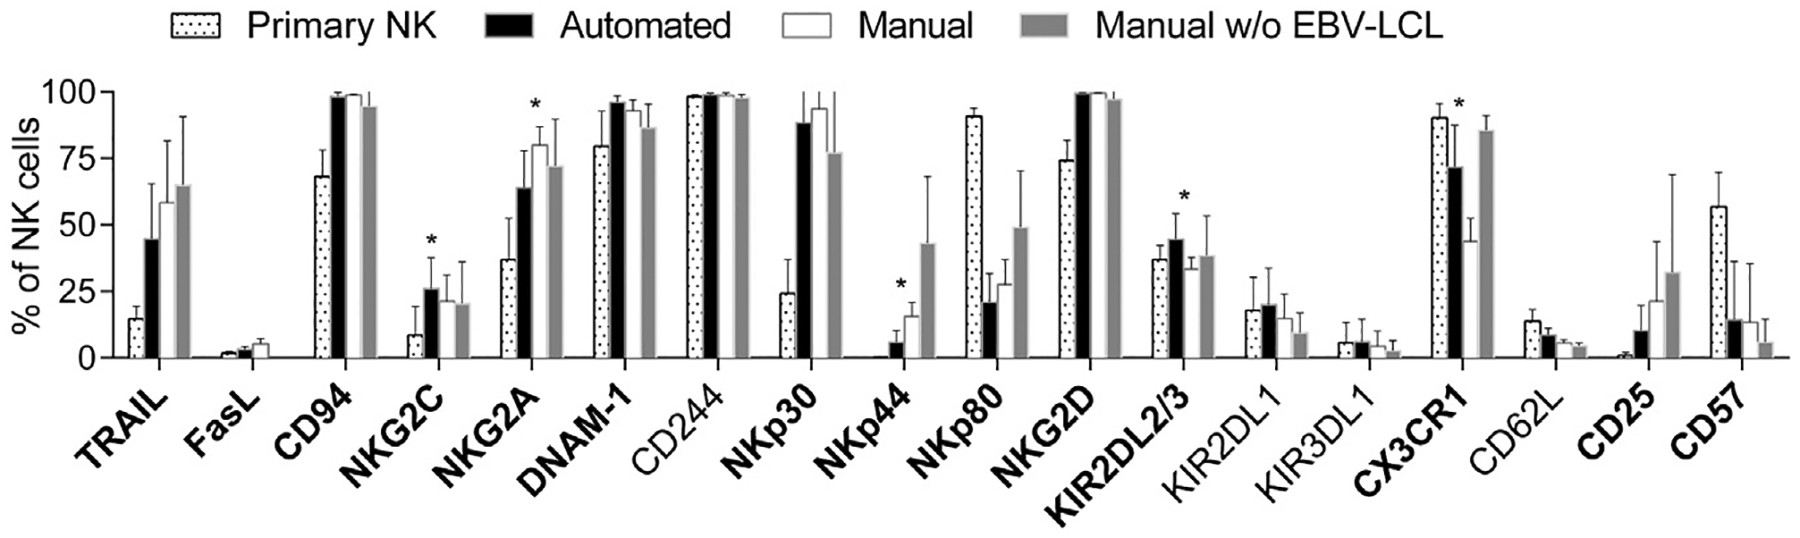
NK cell surface marker expression investigated by means of flow cytometry. NK cells were analyzed by means of flow cytometry for selected surface markers before (primary NK, dotted) or after automated EBV-LCL–based expansion (black bars) in comparison to manual NK cell expansion in T flasks with (white bars) or without (gray bars) EBV-LCL. Five donors were analyzed; mean values and standard deviations are shown. Changes on expansion represented by differences between primary and automatically expanded NK cells were analyzed by means of paired Student’s t-test; markers with P < 0.05 are written in bold letters. In addition, differences between automatically and manually expanded NK cells after co-culture with EBV-LCL were analyzed by means of paired Student’s t-test; markers with P < 0.05 are indicated as significant by a star.