
Figure 4.
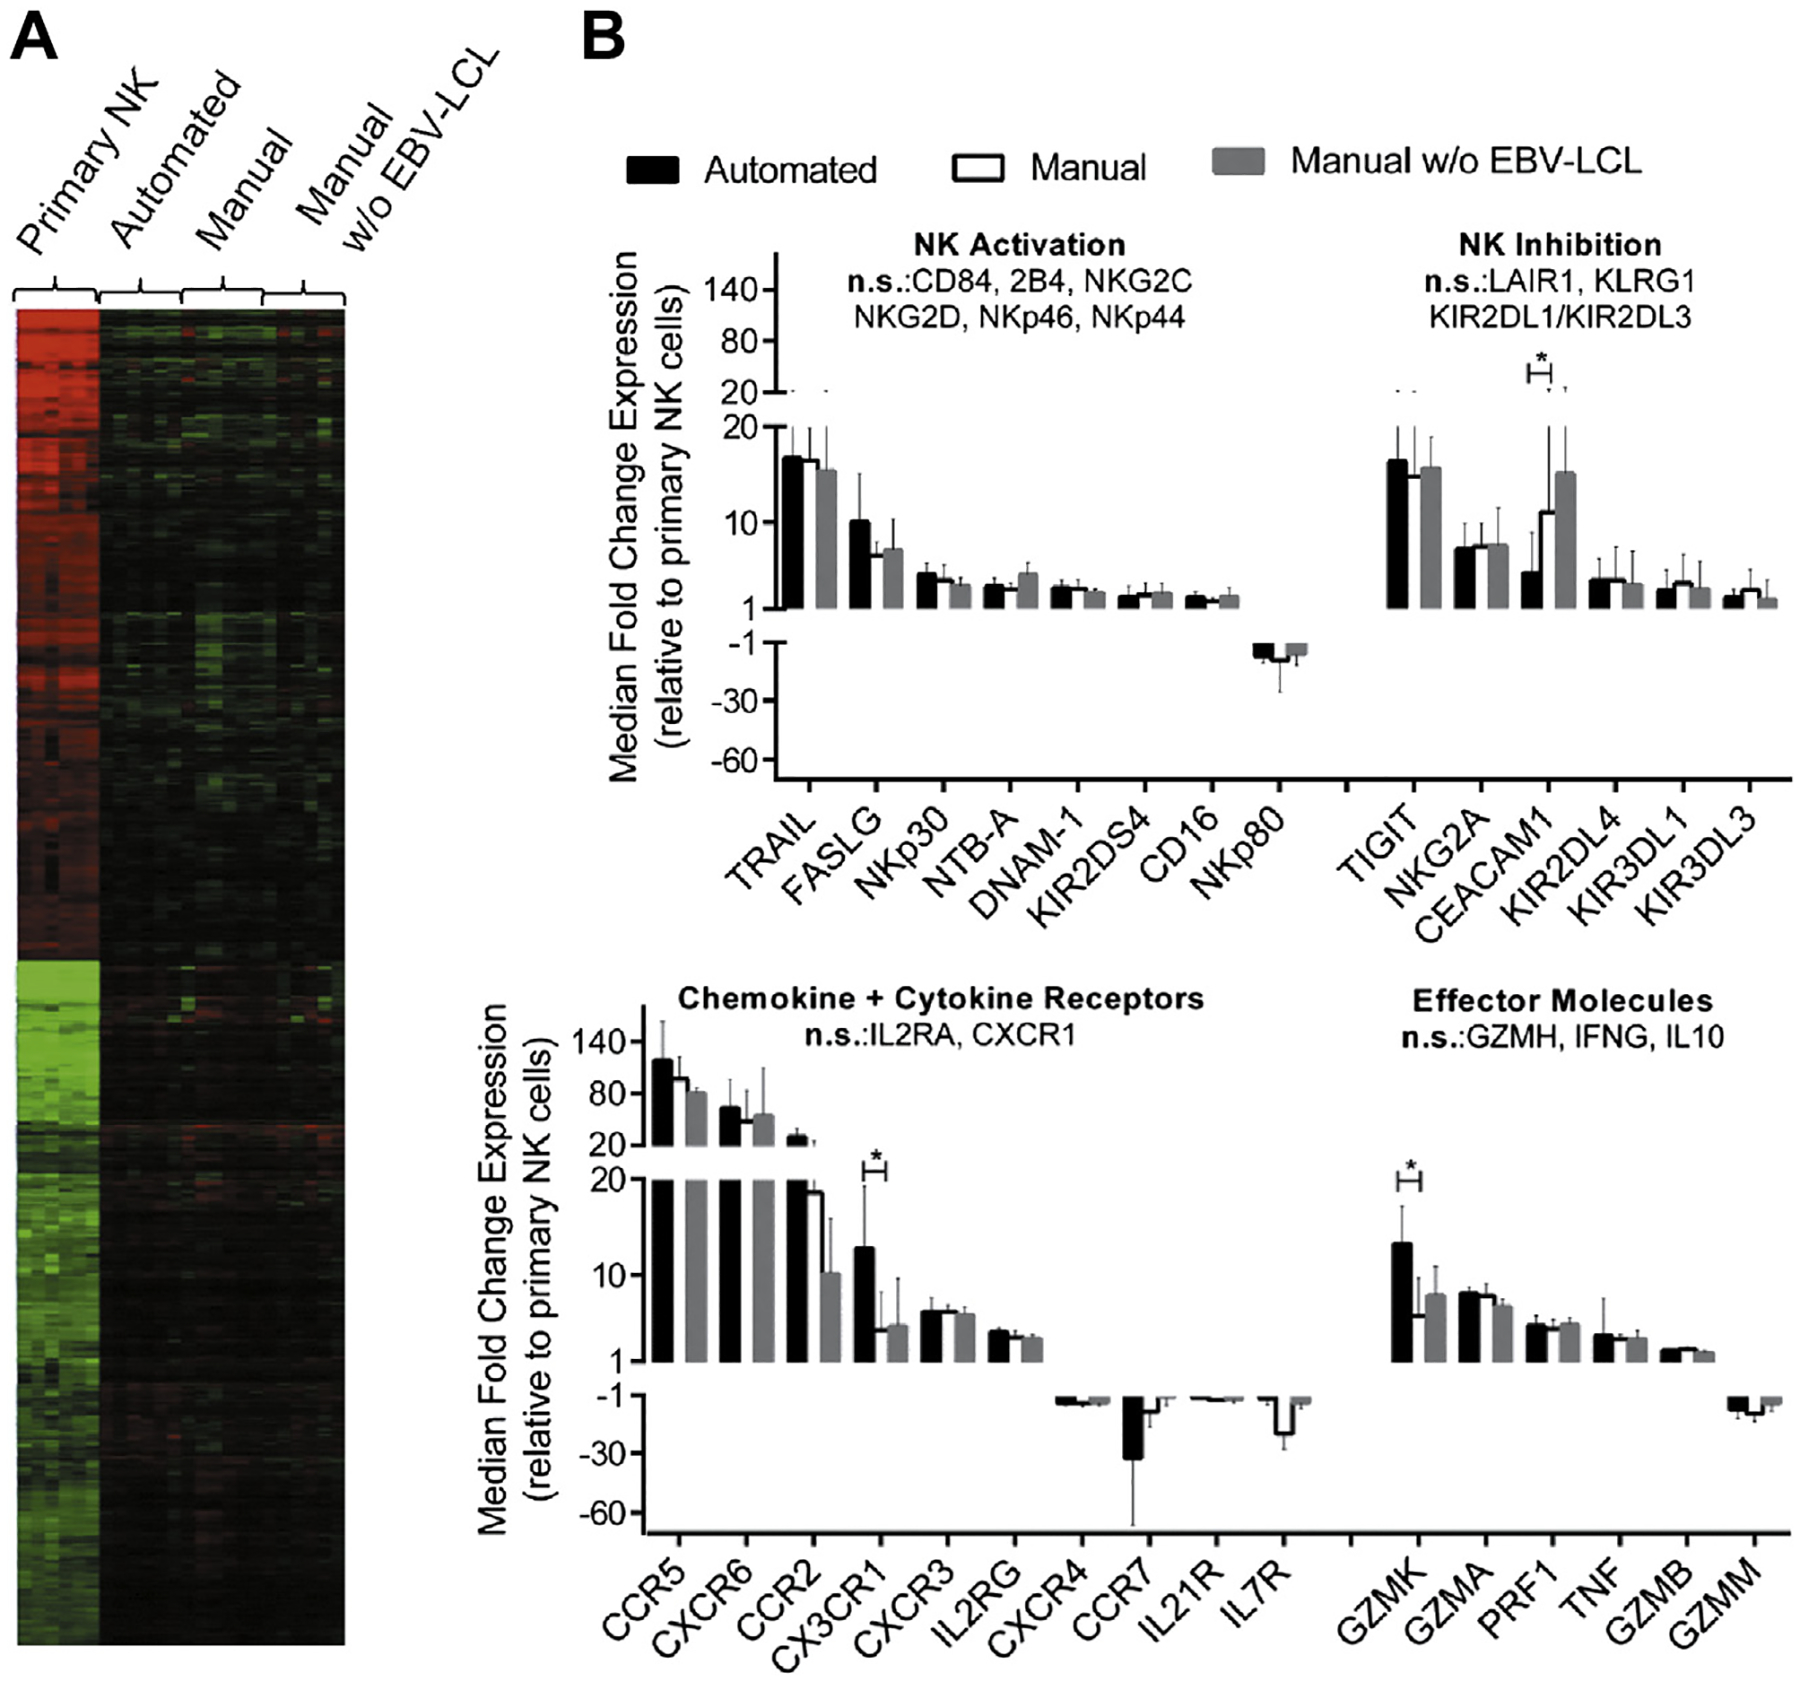
Gene expression profiles of NK cells before and after expansion. Samples from six donors were used for gene expression analysis of primary NK cells and NK cells after automated EBV-LCL–based expansion as well as NK cells after manual expansion in T flasks with or without EBV-LCL. (A) Differentially regulated reporters between the four sample groups were identified by filtering for statistical relevance and reliable signal intensities; median centered values for these reporters are shown in a heat map after hierarchical clustering analysis. Color saturation limits range from log2 intensities of −4 (green) to +4 (red). No changes relative to the reporter-wise median log2 intensity of all samples is displayed in black color. (B) Filtering for NK cell–relevant genes among regulated reporters is displayed for NK cells obtained by the automated process (black bars), manual expansion with EBV-LCL feeders (white bars) or manual expansion without EBV-LCL feeders (gray bars) in relation to primary NK cells. Automated and EBV-LCL–based manual expansion was compared by means of Tukey’s honestly significant differences post hoc test; genes with Tukey P value ≤0.05 and median fold change ≥2 or ≤ −2 are indicated as significant (indicated by stars).