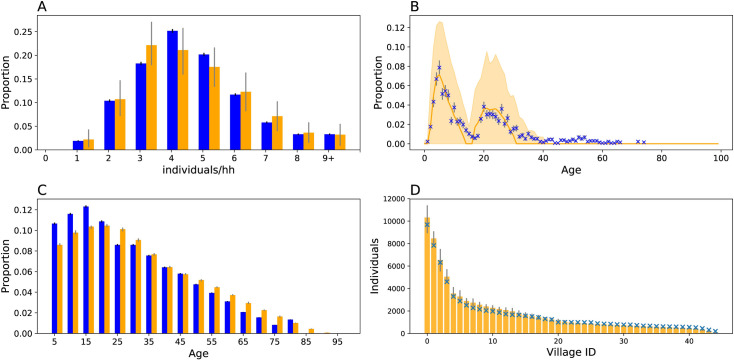
Fig 2. Simulating household structure.
Household demography simulations (orange) compared against demography data from the 2014 BDHSS (blue). Error bars for simulation output represent middle 95 percentile as estimated from 20 random iterations. Error bars for the BDHSS or clinical trial data represent the 95% binomial confidence interval around the mean. A) Household size distribution. B) Housed contact age distributions. C) Age pyramid D) Village size. For D, only simulated confidence intervals are shown.

