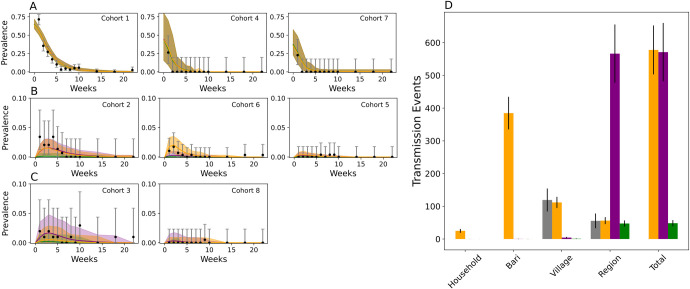
Fig 3. Modeled vs observed patterns of Sabin 2 following the mOPV2 vaccination campaign.
A-C) Sabin 2 shedding in the eight infant and household contact cohorts after the mOPV2 challenge. Only data from the villages assigned with bOPV routine immunization was examined. The cohorts in A (left to right: cohorts one, four, seven) reflect direct vaccination with mOPV2. The cohorts in B (left to right: cohorts two, six, five) reflect transmission that most likely originated from a household or bari member. The cohorts in C transmission (left to right: cohorts three and eight) reflect transmission that most likely originated from a village or non-village member. The data and the 95% binomial confidence interval are shown in black. Simulated results with the multiscale (orange) and the two mass action models (purple and green) are shown. The multiscale model was calibrated to all the clinical trial data (the cohort shedding data and the tOPV data). In purple are the results from the mass action model after calibrating to the cohort shedding data alone, and in green after calibrating to all the clinical trial data. The solid line represents the simulated average and the shading indicates two standard deviations from the mean obtained from 200 simulation replicates. D) Distribution of transmission events in the multiscale (orange) and mass action (green) model compared against the estimates of village and non-village transmission extrapolated from tOPV-derived Sabin 2 transmission during the clinical trial (grey). Error bars represent the 95% confidence interval.

