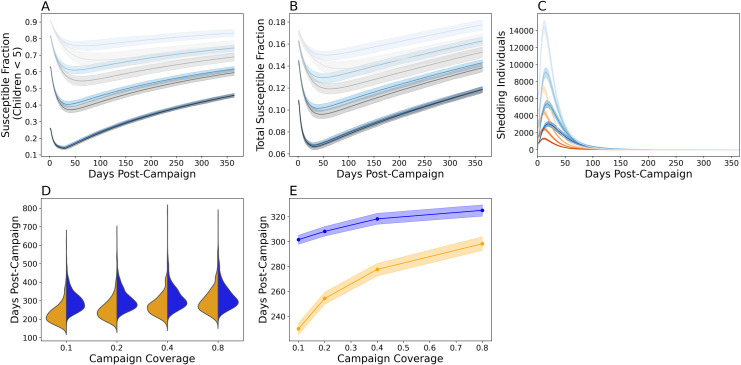
Fig 5. Simulating single-dose mOPV2 campaigns.
The proportion of susceptible individuals with a serum neutralizing antibody titer under eight in A) children under five and B) the entire Matlab population during a single-dose mOPV2 campaign performed five years after the Switch. Simulation results using the multiscale model are shown in blue while those using the mass action model (calibrated without the tOPV) are shown in grey. C) Epi curves showing the number of infected individuals following the mOPV2 campaign before (orange) and five years after (blue) the Switch. For A-C), the darkness of the shading indicates the vaccination coverage in children under five. From darkest to lightest, the coverages were 80%, 40%, 20%, and 10%. 40% was the target coverage in the original mOPV2 campaign. Plotted are the mean expectations and the 95% prediction intervals obtained from 2000 simulation replicates. D) Violin plots showing the distribution of vaccine virus transmission duration before (orange) and five years after (blue) the Switch from 2000 simulation iterations. E) The expected shedding duration before (orange) and five years after (blue) the Switch. The solid line indicates the mean and the shading the bootstrapped 95% confidence interval of the mean.

