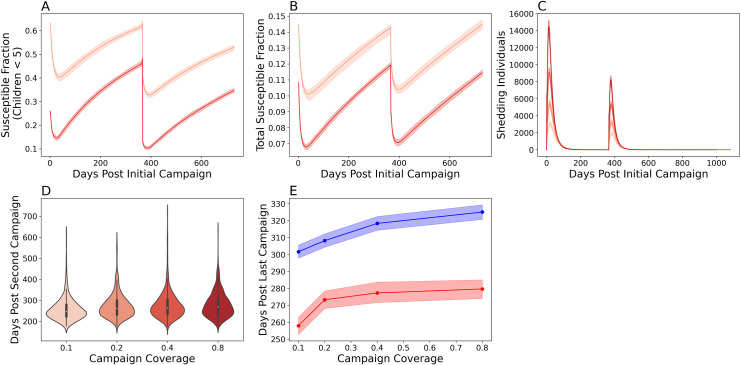
Fig 6. Simulating multiple, single-dose mOPV2 campaigns five years after the Switch.
The proportion of susceptible individuals with a serum neutralizing antibody titer under eight in A) children under five and B) the entire Matlab population following a 40% (light red) and 80% (dark red) coverage campaign. C) Epi curves showing the number of infected individuals following the mOPV2 campaign following an 80% (darkest), 40%, 20%, and 10% (lightest) coverage campaign. D) Violin plots of the total shedding durations following the second campaign. The colors used in C are the same as that for D. E) The expected shedding duration after the first (blue) and second (red) mOPV2 campaign. Both campaigns had 80% coverage in children under five. The solid line indicates the mean and the shading the bootstrapped 95% confidence interval of the mean.

