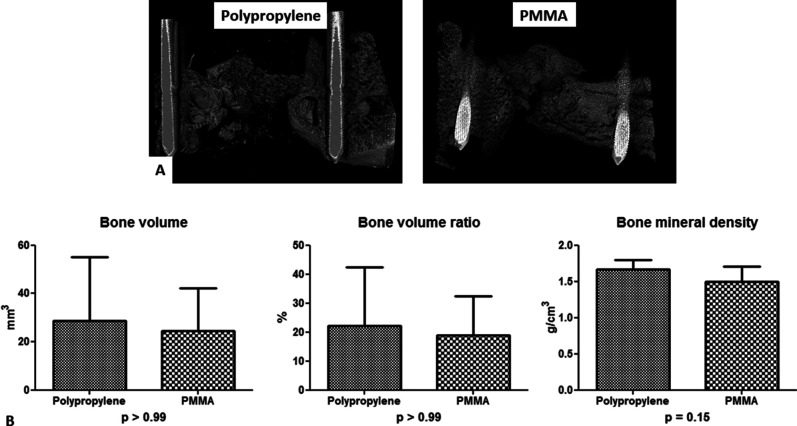
Fig. 8.
A-B Bone formation was assessed using microCT. (A) These images represent demonstrative three-dimensional reconstructions of the region of interest in both groups. (B) The quantitative and comparative analysis showed no difference between the polypropylene (n = 5) and PMMA group (n = 5) in terms of bone volume, bone volume ratio, and bone mineral density.

