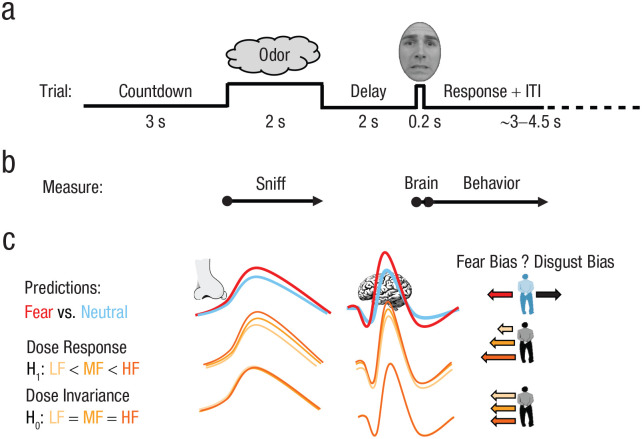
Fig. 3.
Experimental paradigm and predictions. At the start of the experiment, participants provided odor ratings (pleasantness, intensity) and were asked to discriminate between odors. This was followed by the main paradigm (a), in which each morph-task trial began with a 3-s countdown (3, 2, 1) and was followed by a sniff cue, during which the odor was presented. After a short delay, participants saw a face and classified it as either “fear” or “disgust.” The recording timeline (b) shows the main outcome variables: sniff (duration, volume), brain activation, and behavior (bias in judging ambiguous faces). The schematic of expected effects (c) is divided into categorical effects (fear odor [red line] vs. neural odor [blue line]), forming a replication of prior research, and fear-dose effects showing either a linear dose-response function (alternative hypothesis [H1]) or dose-invariance (null hypothesis [H0])—low fear (LF [yellow line]) vs. medium fear (MF [light orange line]) vs. high fear (HF [dark orange line]). Higher amplitudes (lines) reflect an expected stronger response (sniffing, brain activity). In the righthand column, larger arrows to the left reflect an expected greater fear bias on the face-morph task. ITI = intertrial interval.

