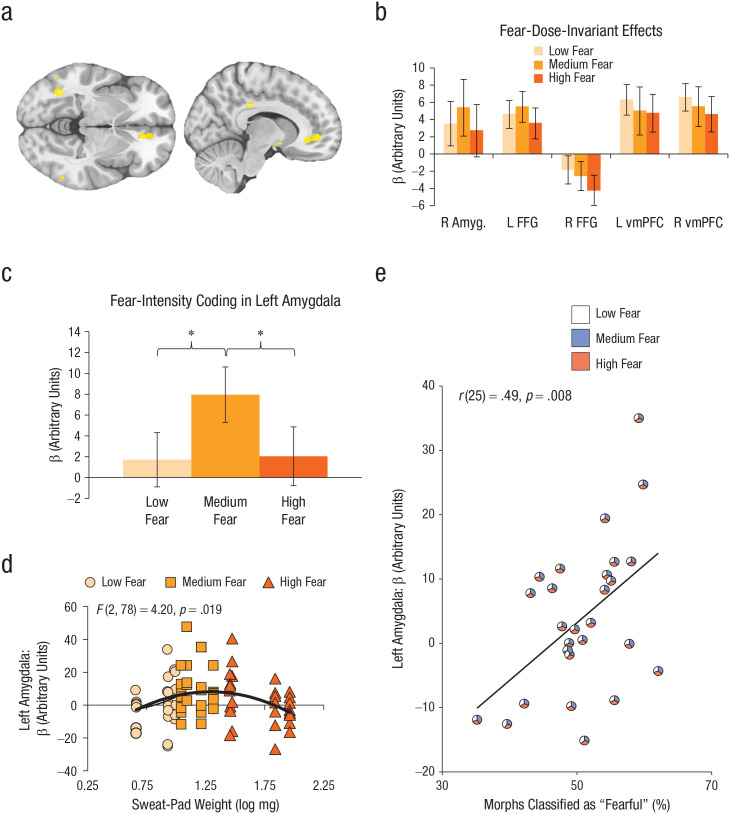
Fig. 5.
Results of whole-brain, region of interest (ROI), and exploratory analyses. The brain images (a) show activations from the whole-brain contrast (fear odor > neutral odor) in fusiform face gyrus (FFG) and ventromedial prefrontal cortex (vmPFC; uncorrected p < .001, 10-voxel threshold). Fear-dose-invariant effects (b; neutral odor was subtracted from each fear level) are shown for separate ROIs: right amygdala, left and right FFG, and left and right vmPFC. Fear-intensity coding (c; fear odors – neutral odors) is shown for the left amygdala. Left amygdala activity (d) is shown as a function of sweat-pad weight and presented fear-sweat dose. The curved line shows the best-fitting linear regression. The scatterplot (e) shows the correlation between left amygdala activity in response to fear sweat (low, medium, high) and the percentage of morphs identified as “fear” (vs. “disgust”). The diagonal line shows the best-fitting regression. Each individualized pie chart displays the relative contribution of low-fear, medium-fear, and high-fear odor trials classified as “fear” to overall fear responses on the morph task and left amygdala activity. Asterisks in (c) indicate significant differences between conditions (*p < .05). Error bars in (b) and (c) represent ±1 SE.

