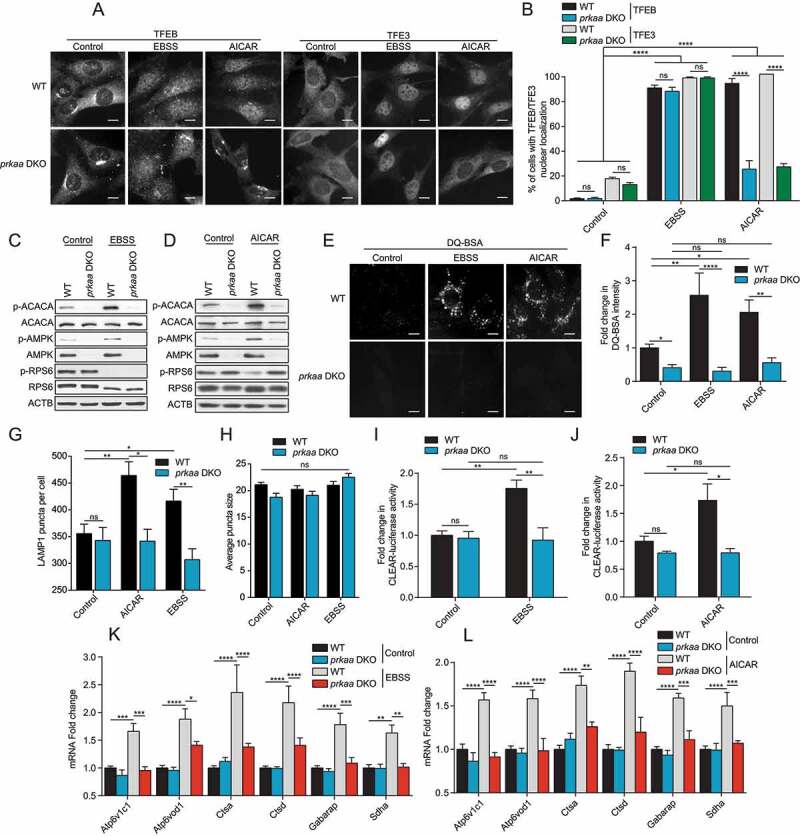
Figure 1.

AMPK is required for complete TFEB and TFE3 activity upon EBSS starvation and AICAR treatment. (A) WT and prkaa DKO MEFs were incubated in complete media (Control), starved (EBSS) or in presence of AICAR (2 mM) for 2 h. Cells were fixed, permeabilized, and stained with an antibody against TFEB or TFE3. Scale bar: 20 μm. Images are representative of three independent experiments. (B) Quantification of the percentage of indicated MEF lines with nuclear TFEB or TFE3 upon treatments as indicated in (A) (mean ± SEM of three independent experiments, two-way ANOVA, ns = not significant, ****P < 0.0001; n > 200 cells per condition). (C-D) Immunoblot of protein lysates of indicated MEF lines treated as indicated in (A). Data are representative of three independent experiments. (E) Representative images of indicated MEF lines after 1 h of incubation with DQ-BSA-Red followed by a 2 h chase in complete media (Control), starved (EBSS) or in presence of AICAR (2 mM) prior to fixation. Scale bar: 20 μm. Images are representative of four independent experiments. (F) Relative lysosomal activity, as determined by DQ-BSA assay, in indicated MEF lines upon treatment as indicated in (E) (mean ± SEM of four independent experiments, two-way ANOVA, ns = not significant, *P < 0.05, **P < 0.01, ****P < 0.0001; n > 200 cells per condition). (G) Quantification of the number of LAMP1 puncta upon treatment as indicated in (A). (mean ± SEM of three independent experiments, two-way ANOVA, ns = not significant, *P < 0.05, **P < 0.01; n > 50 cells per condition). (H) Quantification of the average LAMP1 puncta size upon treatment as indicated in (A). (mean ± SEM of three independent experiments, two-way ANOVA, ns = not significant, n > 50 cells per condition). (I-J) Relative Tfeb and Tfe3 transcriptional activity, as determined by CLEAR-luciferase promoter activity normalized against CMV-Renilla in indicated MEF lines upon treatment as indicated in (A) (mean ± SEM of the luminescence fold change from five independent experiments, two-way ANOVA, ns = not significant, *P < 0.05, **P < 0.01). (K-L) Relative quantitative real‐time PCR analysis of Tfeb and Tfe3 target genes mRNA transcript levels in indicated MEF lines upon treatment as indicated in (A) (mean ± SEM of the RNA fold change of indicated mRNAs from five independent experiments, two-way ANOVA, *P < 0.05, ***P < 0.001, ****P < 0.0001)
