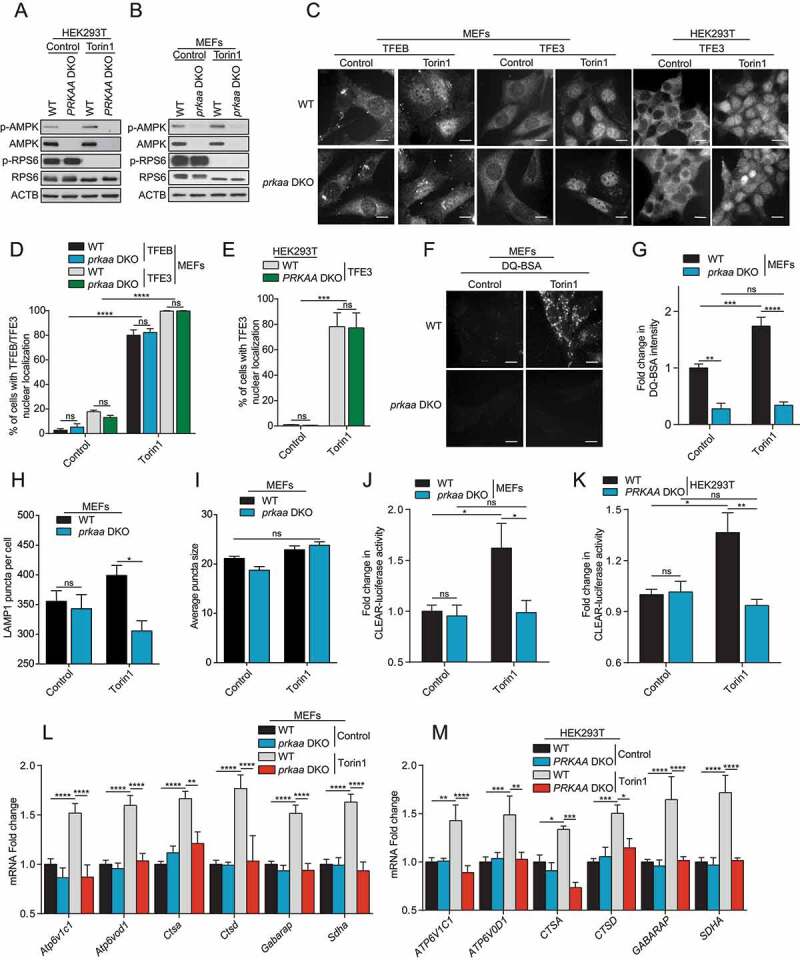
Figure 2.

MTORC1 inhibition requires AMPK for complete TFEB and TFE3 activity. (A-B) Immunoblot of protein lysates of HEK293T (A) and MEFs (B) with indicated genotypes incubated in presence of DMSO (Control) or torin1 (1 μM) for 2 h. Data are representative of three independent experiments. (C) Representative images of cell lines treated as indicated in (A-B). Cells were fixed, permeabilized, and stained with an antibody against TFEB or TFE3. Scale bar: 20 μm. Images are representative of three independent experiments. (D-E) Quantification of the percentage of MEFs (D) and HEK293T (E) with nuclear TFEB or TFE3 upon treatments as indicated in (A-B) (mean ± SEM of three independent experiments, two-way ANOVA, ns = not significant, ***P < 0.001, ****P < 0.0001; n > 200 cells per condition). (F) Representative images of MEFs after 1 h of incubation with DQ-BSA-Red followed by a 2-h chase in complete media in presence of DMSO (Control) or torin1 (1 μM) prior to fixation. Scale bar: 20 μm. Images are representative of four independent experiments. (G) Relative lysosomal activity, as determined by DQ-BSA assay, in MEFs upon treatment as indicated in (F) (mean ± SEM of four independent experiments, two-way ANOVA, ns = not significant, **P < 0.01, ***P < 0.001, ****P < 0.0001; n > 200 cells per condition). (H) Quantification of the number of LAMP1 puncta in MEFs upon treatment as indicated in (A). (mean ± SEM of three independent experiments, two-way ANOVA, ns = not significant, *P < 0.05; n > 50 cells per condition). (I) Quantification of the average LAMP1 puncta size in MEFs upon treatment as indicated in (A). (mean ± SEM of three independent experiments, two-way ANOVA, ns = not significant, n > 50 cells per condition). (J-K) Relative Tfeb and Tfe3 transcriptional activity, as determined by CLEAR-luciferase promoter activity normalized against CMV-Renilla in MEFs (J) and HEK293T (K) upon treatment as indicated in (A) (mean ± SEM of the luminescence fold change from four independent experiments, two-way ANOVA, ns = not significant, *P < 0.05, **P < 0.01). (L-M) Relative quantitative real‐time PCR analysis of Tfeb and Tfe3 target genes mRNA transcript levels in MEFs (L) and HEK293T (M) upon treatment as indicated in (A) (mean ± SEM of the RNA fold change of indicated mRNAs from four independent experiments, two-way ANOVA, *P < 0.05, **P < 0.01, ***P < 0.001, ****P < 0.0001)
