Figure 7.

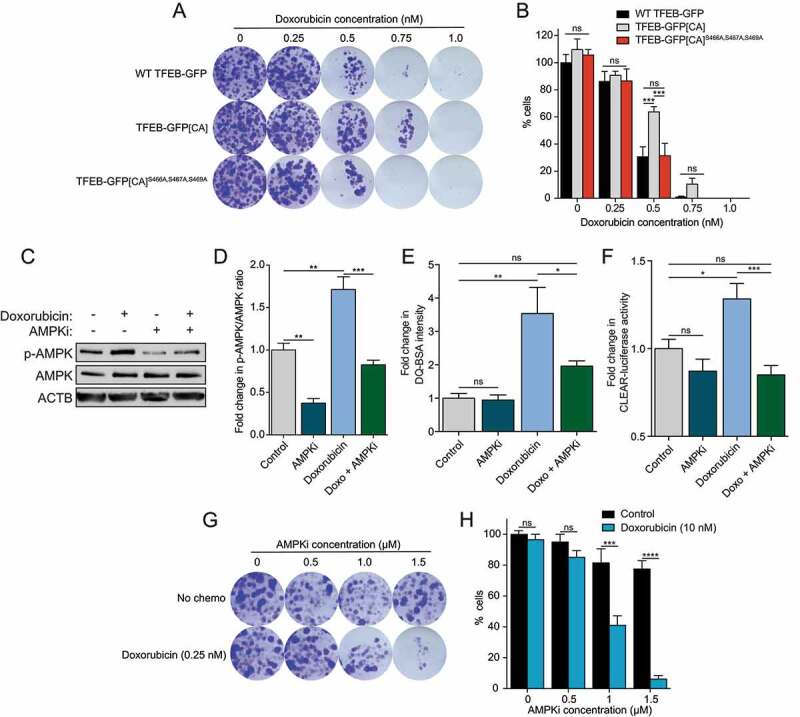
S466A S467A S469A and AMPK inhibition reduce doxorubicin resistance. (A) Representative images of MEFs incubated for 7 days in complete media in presence of indicated doxorubicin concentrations, fixed and stained with crystal violet. Images are representative of three independent experiments. (B) Quantification of the percentage of cells remaining upon treatments as indicated in (A) (mean ± SEM of three independent experiments, two-way ANOVA, ns = not significant, ***P < 0.001). (C) Immunoblot of protein lysates of WT MEFs incubated in complete media in presence of doxorubicin (10 nM) and/or SBI-0206965 (AMPKi, 5 μM) for 24 h. Data are representative of three independent experiments. (D) Quantification of the p-AMPK:AMPK ratio upon treatments as indicated in (C) (mean ± SEM of three independent experiments, one-way ANOVA, **P < 0.01, ***P < 0.001). (E) Relative lysosomal activity, as determined by DQ-BSA assay, in MEFs upon treatment as indicated in (C) (mean ± SEM of four independent experiments, one-way ANOVA, ns = not significant, **P < 0.01; n > 200 cells per condition). (F) Relative Tfeb and Tfe3 transcriptional activity, as determined by CLEAR-luciferase promoter activity normalized against CMV-Renilla in MEFs upon treatment as indicated in (C) (mean ± SEM of the luminescence fold change from five independent experiments, one-way ANOVA, ns = not significant, ***P < 0.001). (G) Representative images of MEFs incubated for 7 days in complete medßia in presence of doxorubicin (0.25 nM) and indicated SBI-0206965 (AMPKi) concentrations, fixed and stained with crystal violet. Images are representative of three independent experiments. (H) Quantification of the percentage of cells remaining upon treatments as indicated in (G) (mean ± SEM of three independent experiments, two-way ANOVA, ns = not significant, ***P < 0.001, ****P < 0.0001)
