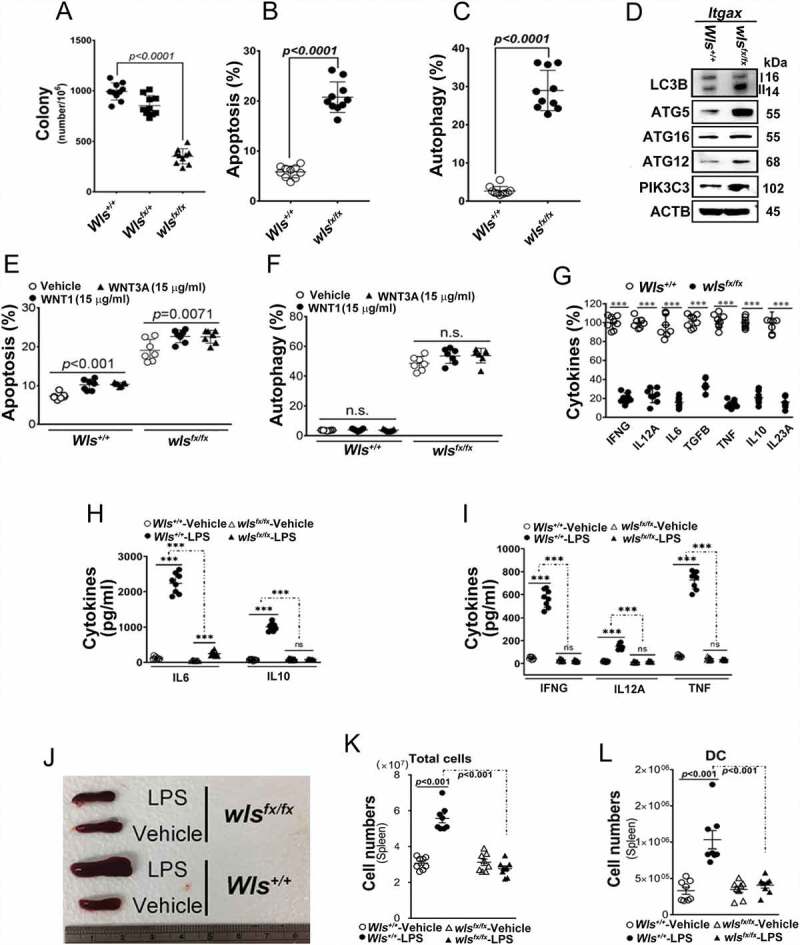
Figure 1.

Effect of WLS deficiency on BMDCs. (A) Colony formation of BMDCs with wild-type, heterozygous, or wls-null (wlsfx/fx) genotypes (n = 8). (B and C) Percentage of apoptotic and autophagic BMDCs with wild-type, heterozygous, or wls-null genotypes (n = 8). (D) Western blots of autophagic markers (LC3B, PIK3C3, ATG5, ATG12 and ATG16L1) in lysates of wild-type and wls-null BMDCs (n = 3; p< 0.001). (E) Percentage of apoptotic BMDCs with wild-type and wls-null genotypes by WNT1 and WNT3A treatment. (F) Percentage of autophagic BMDCs with wild-type and wls-null genotypes after WNT1 and WNT3A treatment. (G) Level of cytokine-expressing cells in wild-type or wls-null (wlsfx/fx) BMDCs. (H) Levels of IL12A, IL6, and IL10 secreted by wild-type and wls-null BMDCs, or (I) IFNG and TNF secreted by cocultured CD4+ T cells in the presence or absence of LPS. (J) Spleen size in wild-type and DC-specific wls-null mice with or without LPS treatment. Flow cytometric analysis of the total number of (K) splenocytes and (L) DCs in wild-type and DC-specific wls-null mice after LPS treatment (n = 8; p< 0.001)
