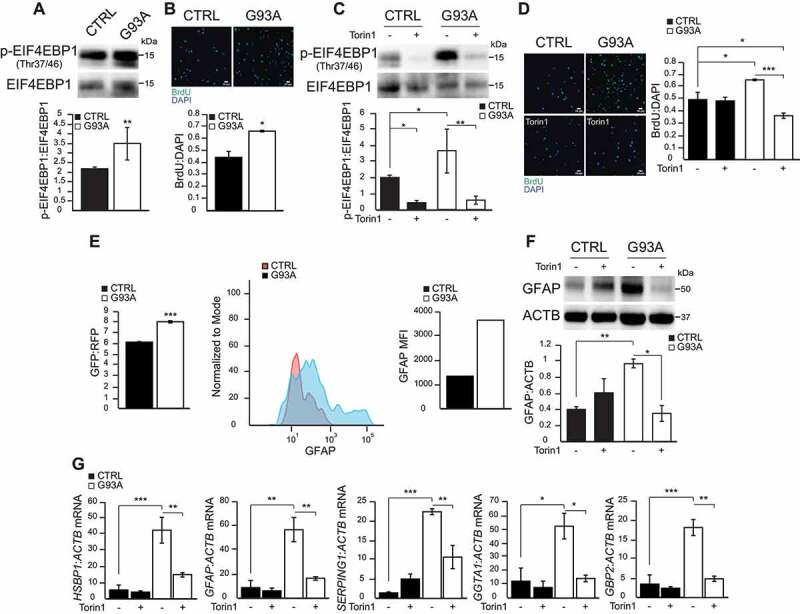
Figure 2.

EIF4EBP1 phosphorylation, cell proliferation, and GFAP expression are elevated in SOD1G93A iPSA. (A) Representative western blot and quantification of CTRL and G93A iPSA of p-EIF4EBP1 (Thr37/46) protein levels normalized to total EIF4EBP1 (n = 6). (B) Representative images of CTRL and G93A iPSA stained with BrdU (green) and DAPI (blue), and quantification of cell proliferation expressed as BrdU:DAPI ratio (n = 9). CTRL and G93A iPSA were treated with 250 nM Torin1 (+) or vehicle (-) for 24 h. (C) Representative western blot and quantification of p-EIF4EBP1 (Thr37/46) protein levels normalized to total EIF4EBP1 (n = 3). (D) Representative images of CTRL and G93A iPSA stained with BrdU (green) and DAPI (blue), and quantification of cell proliferation (n = 9). (E) Quantification of GFP:RFP fluorescence ratio of GFP-LC3-RFP-LC3ΔG transduced cells FACS sorted based on GFP and RFP double positivity (n = 3). Representative histograms and quantification of GFAP MFI of FACS-sorted cells pooled from three transduction experiments. (F) Representative western blot and quantification of GFAP protein levels normalized to ACTB (n = 3). (G) HSBP1, GFAP, SERPING1, GGTA1, GBP2 mRNA levels normalized to ACTB (n = 3), to assess astrocytes reactivity. P values <0.05 by Mann–Whitney test (A) or by unpaired Student’s t test (B) or by one-way ANOVA test with Sidak’s correction between indicated groups (C, D, F, G) are shown
