
Figure 4.
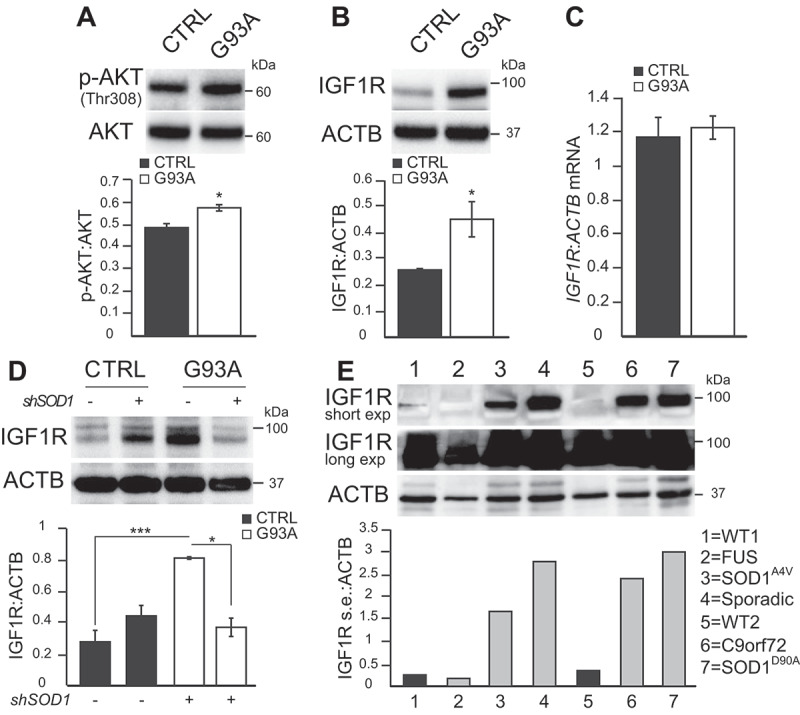
IGF1R levels are increased in SOD1G93A iPSA. (A) Representative western blot and quantification of CTRL and G93A iPSA of p-AKT (Thr308) protein levels normalized to total AKT (n = 3), (B) IGF1R protein levels normalized to ACTB (n = 6). (C) IGF1R mRNA levels normalized to ACTB (n = 3). (D) CTRL and G93A iPSA were transduced with shSOD1 lentiviral particles (+) or negative control (-) for 48 h prior to the assays. Representative western blot and quantification of IGF1R protein levels normalized to ACTB (n = 4). P values <0.05 by unpaired Student’s t test (A-B) or by one-way ANOVA test with Sidak’s correction between the indicated groups (D) are shown. (E) Representative western blot of WT lines from healthy subjects (lane 1–5) and ALS iPSA (FUS, SOD1AV4, Sporadic, C9orf72, SOD1D90A in lane 2, 3, 4, 6, 7, respectively) and quantification of IGF1R protein levels normalized to ACTB