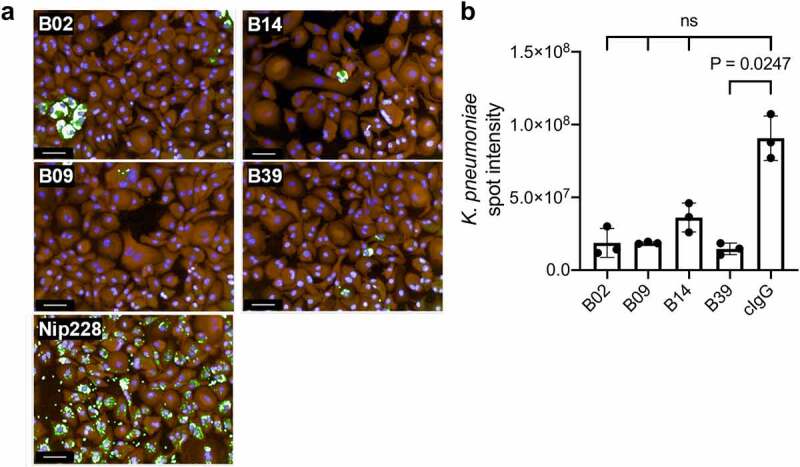
Figure 4.

OPK of K. pneumoniae by macrophages in the presence of carbohydrate binding antibodies by HCI. a) Representative images of bacterial clearance after a 7-hour incubation. Fixed and permeabilised cells were treated with rabbit polyclonal anti-K. pneumoniae 43816 and stained with the nuclear stain Hoechst (blue), macrophage stain cell mask Orange (Orange), and AF488 anti-rabbit IgG (green). Images from 15 fields were acquired using an Opera system (PerkinElmer) at 20 x magnification. Scale bar represents 50 μm. b) Quantification of AF488 intensity sum of K. pneumoniae spots in the macrophage cytoplasmic region. Kruskal-Wallis with Dunn’s correction for multiple comparisons test was used; Kruskal-Wallis statistic: 10.63. ns = not significant. cIgG = negative isotype control
