Figure 6.

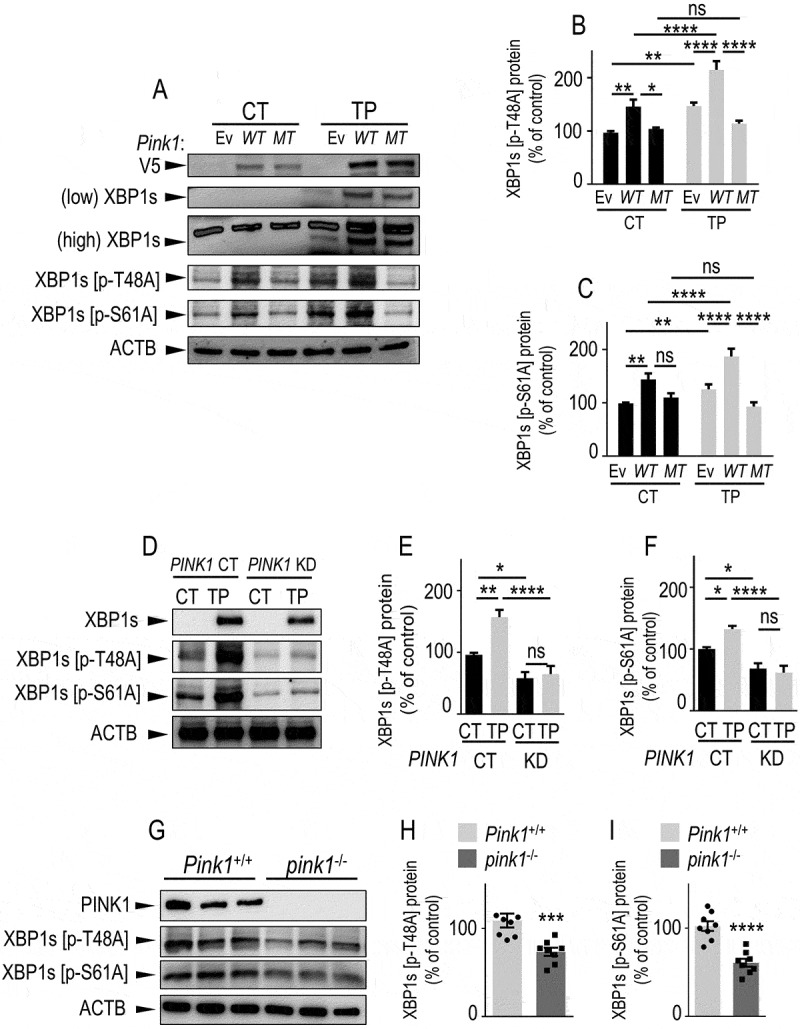
PINK1 phosphorylates XBP1s on threonine 48 and serine 61 residues in cells and in mice brain. (A-C) SH-SY5Y cells were transiently transfected with an empty vector (Ev), V5-tagged WT Pink1 (WT) or kinase-dead Pink1 mutant (Pink1K219M, MT) cDNAs. Twenty-four hours after transfection, cells were treated for 8 h with either vehicle (CT, black bars) or thapsigargin (TP, 1 µM, gray bars). (D-F) PINK1 CT and PINK1 KD cells were treated as in A-C with either vehicle (CT, black bars) or thapsigargin (TP, 1 µM, gray bars). V5-tagged PINK1 (A), total XBP1s (A and D) and phosphorylated XBP1s (A and D, pXBP1s [p-S61A], pXBP1s [p-T48A]) expressions were measured by western blot as described in Methods. (B,C,E,F) Data corresponding to indicated XBP1s phosphorylated species are expressed as percent of untreated Ev (B and C, N = 15) or PINK1 CT cells (E and F, N = 12 and 6 respectively) (taken as 100%) and are the means ± SEM of 2–5 independent experiments performed in triplicate. Statistical significances were performed by two-way ANOVA, Tukey’s multiple comparisons test, ns, non-significant, * P < 0.05, ** P < 0.01, **** P < 0.0001. (G-I) western blot analysis of pXBP1s [p-S61A] and pXBP1s [p-T48A] in Pink1+/+ and pink1−/- mice brain. Bars are the means ± SEM of 8 mice per group. Statistical significances were analyzed by Mann-Whitney’s test (H) and Student’s t test (I), ***, p < 0.001; ****, p < 0.0001
