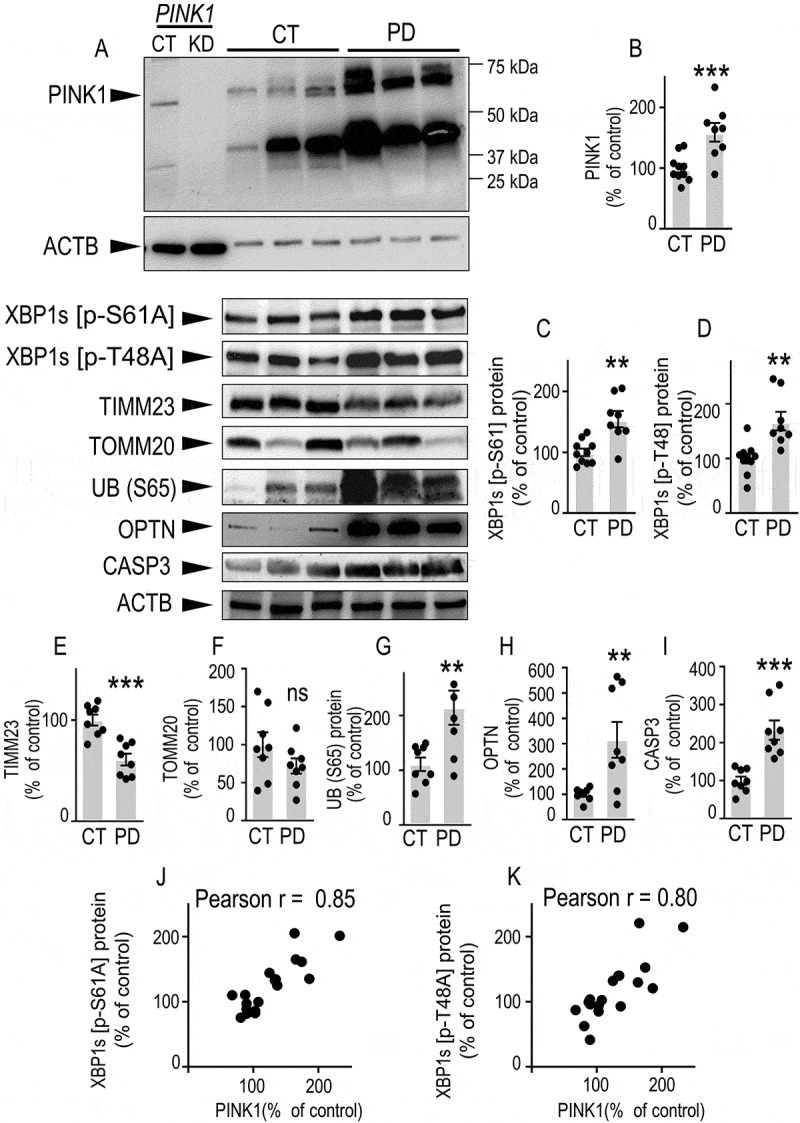
Figure 8.

PINK1, XBP1s phosphorylation and mitophagic markers expressions are altered in sporadic Parkinson disease (PD)-affected brains. (A-J) PINK1 (A and B), XBP1s [p-S61A] (A and C), XBP1s [p-T48A] (A and D), TIMM23 (A and E), TOMM20 (A and F), UB (S65) (A and G), OPTN (A and H) and CASP3 (A and I) protein expressions in control (CT, N = 10) and PD, (N = 8) brains were analyzed by western blot as described in the Methods. Data are expressed as percent of CT brains (taken as 100%). Statistical significances were analyzed by Student’s t test: ns, non-significant, ** P < 0.01, *** P < 0.001. Correlations analyses of PINK1 and XBP1s [p-S61A] (J) and XBP1s [p-T48A] (K) protein expressions are illustrated in (J and K). PINK1 full gel illustrating the migration profile of full-length PINK1 in control (PINK1 CT) and shRNA-depleted PINK1 (PINK1 KD) samples is provided in (A). A representative ACTB gel is provided to illustrate equal protein load
