Figure 1.

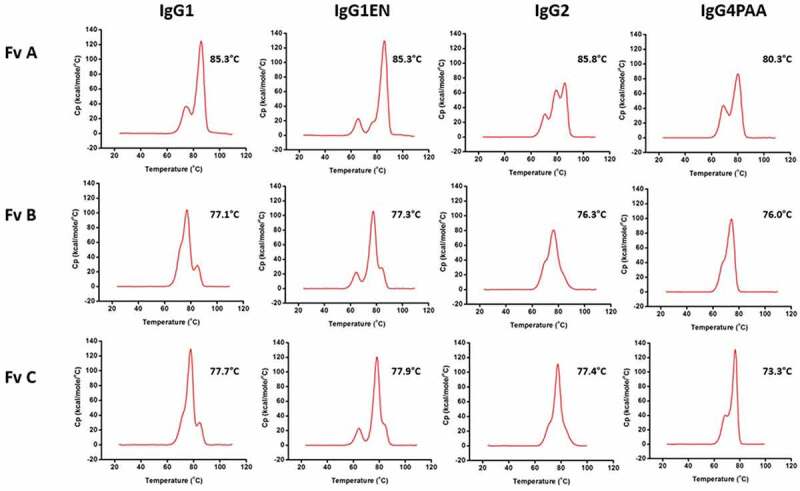
DSC profiles of the 12 antibodies with Fv A, Fv B, Fv C at pH 6. Temperatures listed represent the Tm of the highest peak

DSC profiles of the 12 antibodies with Fv A, Fv B, Fv C at pH 6. Temperatures listed represent the Tm of the highest peak