Figure 3.

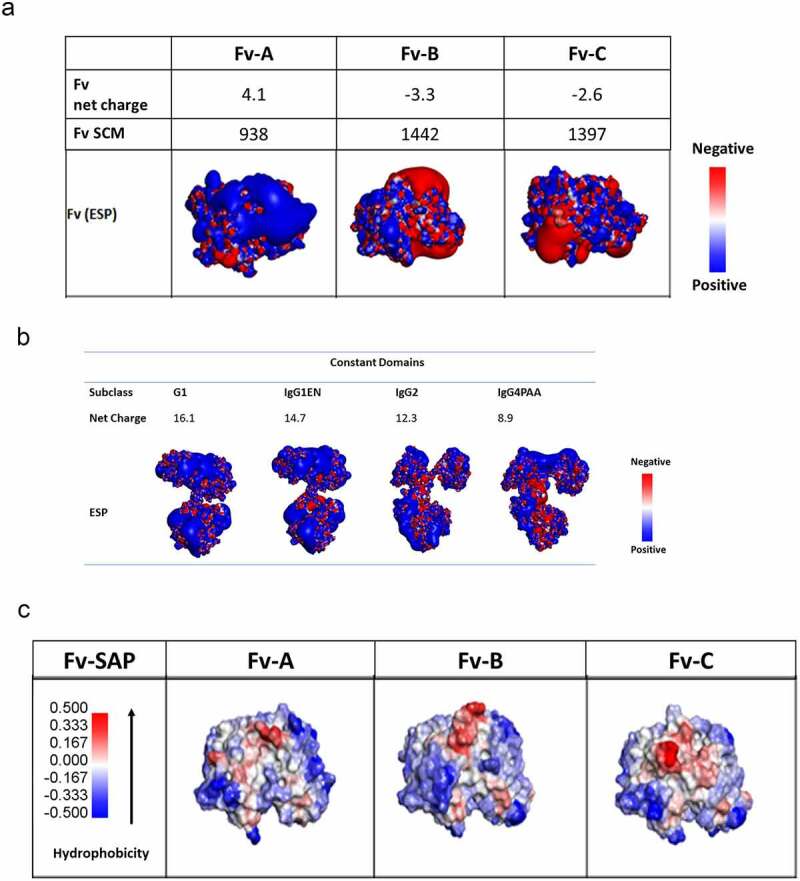
Surface charge analysis at pH 6 (3a and 3b) and hydrophobic patch analysis (3c) for the antibodies with variable region of Fv A, B, and C (3a) in the subclass structure of IgG1, IgG1EN, IgG2, and IgG4PAA by homology modeling

Surface charge analysis at pH 6 (3a and 3b) and hydrophobic patch analysis (3c) for the antibodies with variable region of Fv A, B, and C (3a) in the subclass structure of IgG1, IgG1EN, IgG2, and IgG4PAA by homology modeling