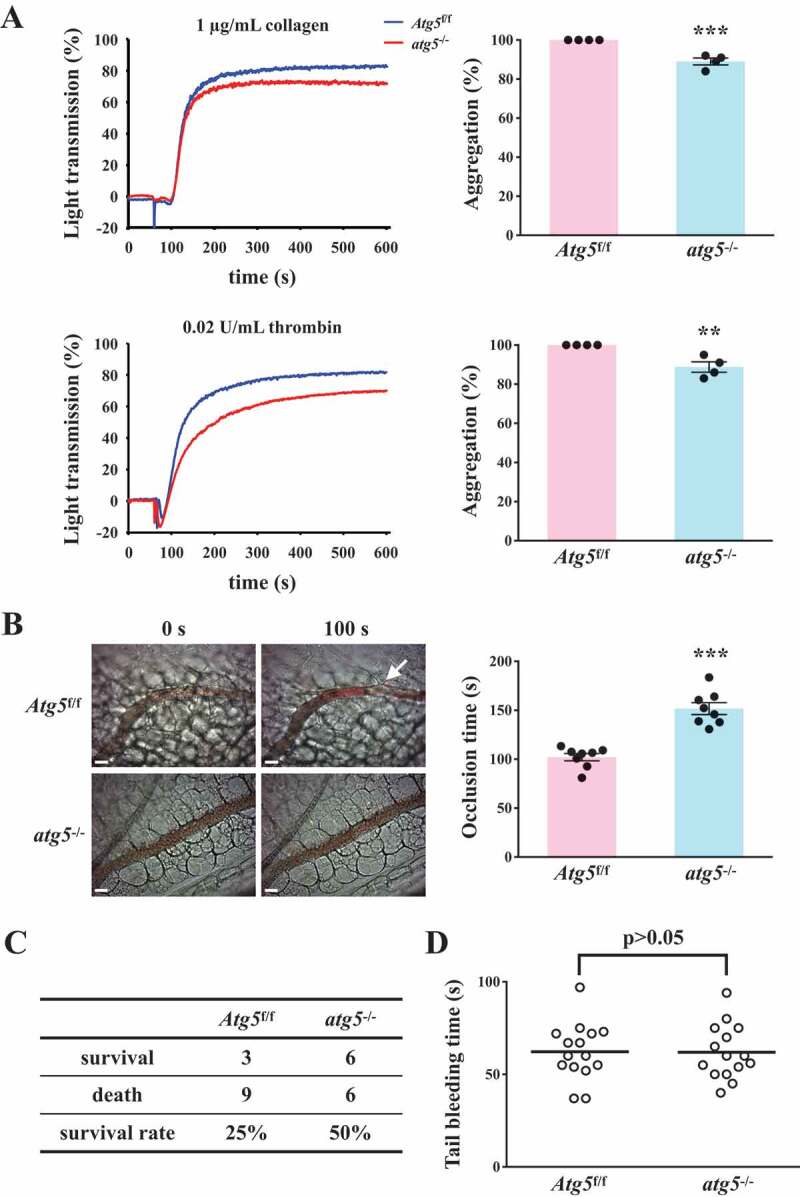
Figure 5.

Effects of platelet autophagy in platelet activation and thrombosis in platelet-specific atg5−/− mice. (A) Washed platelets from Atg5f/f or platelet-specific atg5−/− mice stimulated with 1 μg/mL collagen (top panel) or 0.02 U/mL α thrombin (bottom panel) to trigger platelet aggregation. Data are presented as the means ± S.E.M. (n = 4). **P < 0.01 and ***P < 0.001, compared with the Atg5f/f mice. (B) Atg5f/f or platelet-specific atg5−/− mice intravenously administered with sodium fluorescein. Mesenteric venules were subsequently irradiated to induce microthrombus formation that was continually recorded under a fluorescence microscope. The objective lens had a magnification of ×40. Scale bar: 200 µm. The arrow indicates thrombus. The occlusion time in the right panel is presented as the means ± S.E.M. (n = 8). ***P < 0.001, compared with the Atg5f/f mice. (C) Acute pulmonary thromboembolic death of mice determined after Atg5f/f and platelet-specific atg5−/− mice were injected with ADP (1.4 g/kg) through the tail vein (n = 12). (D) Bleeding induced by severing the tail of Atg5f/f and platelet-specific atg5−/− mice at 3 mm from the tail tip. The bleeding tail stump was immersed in saline. The bleeding time was continuously recorded until no sign of bleeding was observed for at least 10 s. Each point in the scatter plot graph represents a mouse (n = 15)
