
Figure 2.
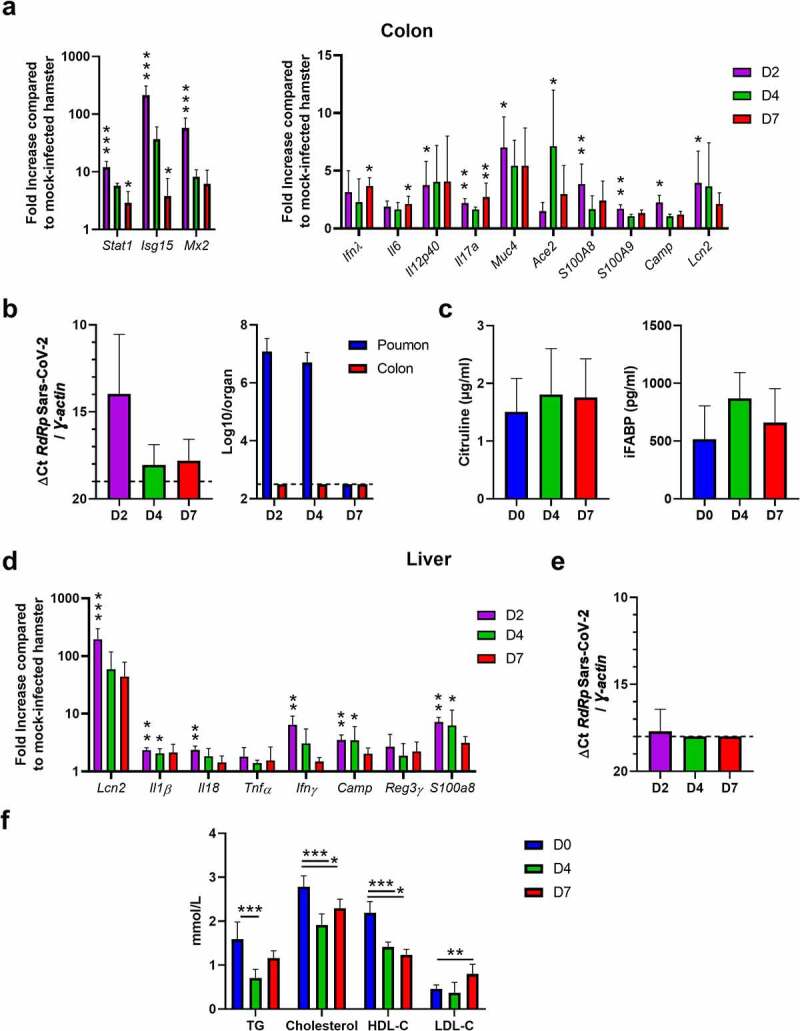
Analysis of gut disorders during SARS-CoV-2 infection. Hamsters were infected as described in Figure 1. (a) The colon of mock-infected and SARS-CoV-2-infected hamsters were collected at 2 (D2), 4 (D4) and 7 (D7) dpi. mRNA copy numbers of genes were quantified by RT-PCR. Data are expressed as fold increase over average gene expression in mock-treated animals. (b) Left panel, SARS-CoV-2 RNA in the colon was quantified by quantitative RT-PCR. Data are expressed as delta Ct values. Right panel, Determination of infectious viral loads in the colon. The number of infectious virus in the lung is depicted for comparison. Data are expressed as the number of infectious virus particles per organ. The dashed line represents the detection threshold. (c) Citrulin (left panel) and intestinal fatty-acid binding protein (iFABP) (right panel) concentrations in the blood of mock-infected and SARS-CoV-2-infected hamsters. (d) The livers of mock-infected and SARS-CoV-2-infected hamsters were collected at 2, 4 and 7 dpi. mRNA copy numbers of genes were quantified by RT-PCR. (e) Quantification of viral RNA-dependent RNA polymerase (RdRp) transcript levels in the liver was quantified by RT-PCR. Data are expressed as delta Ct values. The dashed line represents the detection threshold. Results are expressed as the mean ± SD. (f) Blood (serum) concentrations of triglycerides (TG), cholesterol, high-density lipoprotein cholesterol (HDL-C), and low-density lipoprotein cholesterol (LDL-C). (a-f) Results are expressed as the mean ± SD. A representative experiment out of two is shown (n = 5 to 8/time point). Significant differences were determined using the Kruskal–Wallis ANOVA test (*P < 0.05; ** P < 0.01; *** P < 0.001)