
Figure 1.
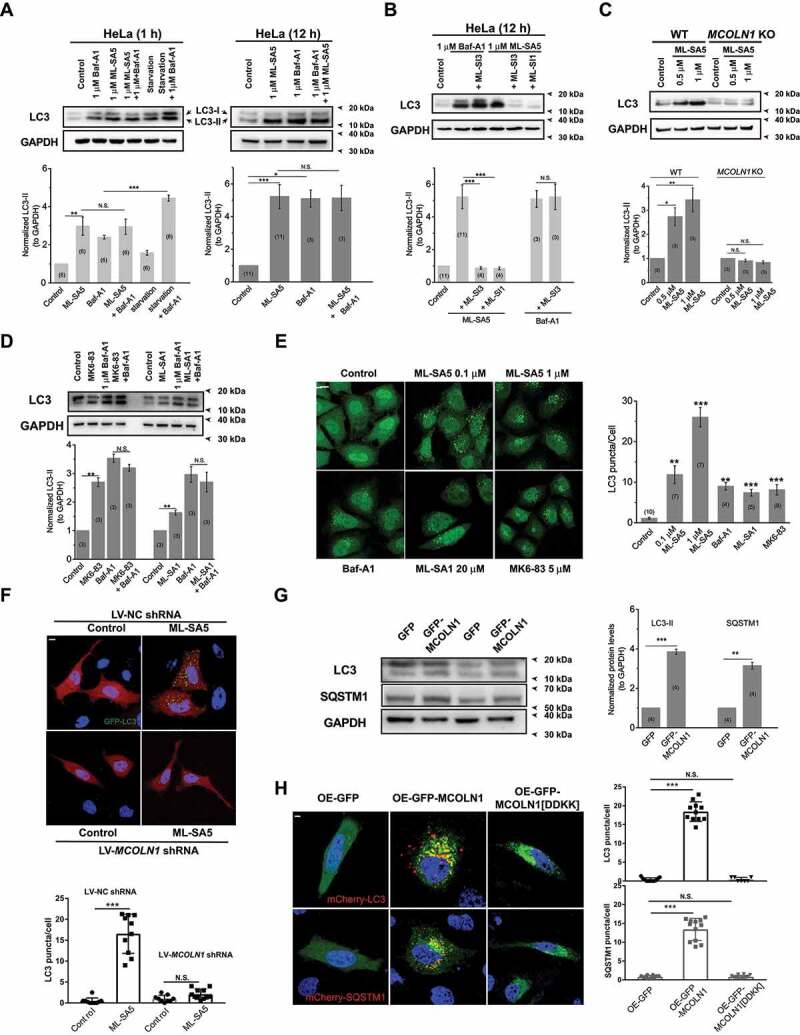
The activation of MCOLN1 specifically regulates autophagy. (A) Both 1 h (left) and 12 h (right) application of ML-SA5 (1 μM) led to an increase in LC3-II levels in HeLa cells, indicated by the normalized LC3-II levels to GAPDH. GAPDH served as a loading control. Starvation (AA-and FBS-free) and Baf-A1 (1 μM) were positive controls for autophagy assessments. Quantification of normalized LC3-II levels under conditions indicated were displayed. (B) The antagonists of MCOLN1, ML-SI1 (20 μM) or ML-SI3 (20 μM), completely inhibited the increases in LC3-II levels triggered by ML-SA5 (1 μM) in HeLa cells, but not ones by Baf-A1 (1 μM). (C) In contrast to WT HAP1 cells, application of ML-SA5 did not lead to an increase in LC3-II levels in MCOLN1 KO HAP1 cells. Deletion of MCOLN1 was confirmed by genotyping (data not shown). (D) Another two MCOLN1 agonists, MK6-83 (5 μM) and ML-SA1 (20 μM), also led to significant increases in LC3-II levels in HeLa cells, respectively. Baf-A1 (1 μM) application did not further facilitate LC3-II increases caused by either MK6-83 or ML-SA1 treatments. All treatments were for 4 h. (E) Four hour treatments of 0.1 μM ML-SA5, 1 μM ML-SA5, 5 μM MK6-83 or 20 μM ML-SA1 caused increased abundance of LC3 puncta in GFP-LC3 stably expressing HEK 293 T (S-GFP-LC3) cell lines, respectively. Baf-A1 (1 μM) was a positive control for inducing LC3 puncta structures. LC3 puncta per cell under the control, ML-SA5 treatments (0.1 μM and 1 μM), MK6-83 (5 μM), ML-SA1 (20 μM) and Baf-A1 (1 μM) were quantified from 4–11 independent experiments (typically 10–40 cells). Scale bar: 10 μm. (F) The LC3 puncta structures induced by the ML-SA5 treatment (1 μM) were profoundly inhibited by reducing MCOLN1 expression with LV-MCOLN1 shRNA in GFP-LC3 transiently expressed HeLa cells. LC3 puncta per cell were quantified from 9–11 cells from at least three independent experiments. Scale bar: 10 μm. (G) GFP-MCOLN1-expressing HeLa cells yielded higher basal LC3-II levels and SQSTM1 levels than GFP-expressing cells, measured by western blot experiments. Transfection efficiency was confirmed by fluorescence microscopy. (H) Overexpressing MCOLN1 significantly induced LC3 or SQSTM1 puncta structures, whereas a channel-dead pore mutant MCOLN1[DDKK] did not induce overt LC3 or SQSTM1 puncta structures in mCherry-LC3 or mCherry-SQSTM1 transiently expressed HeLa cells. LC3 or SQSTM1 puncta per cell were quantified from 7–12 cells from three independent experiments. Scale bar: 10 μm. Means ± SEMs are shown in panels A-H. Significant differences were evaluated using one-way ANOVA followed by Tukey’s test. *P < 0.05; **P < 0.01; ***P < 0.001